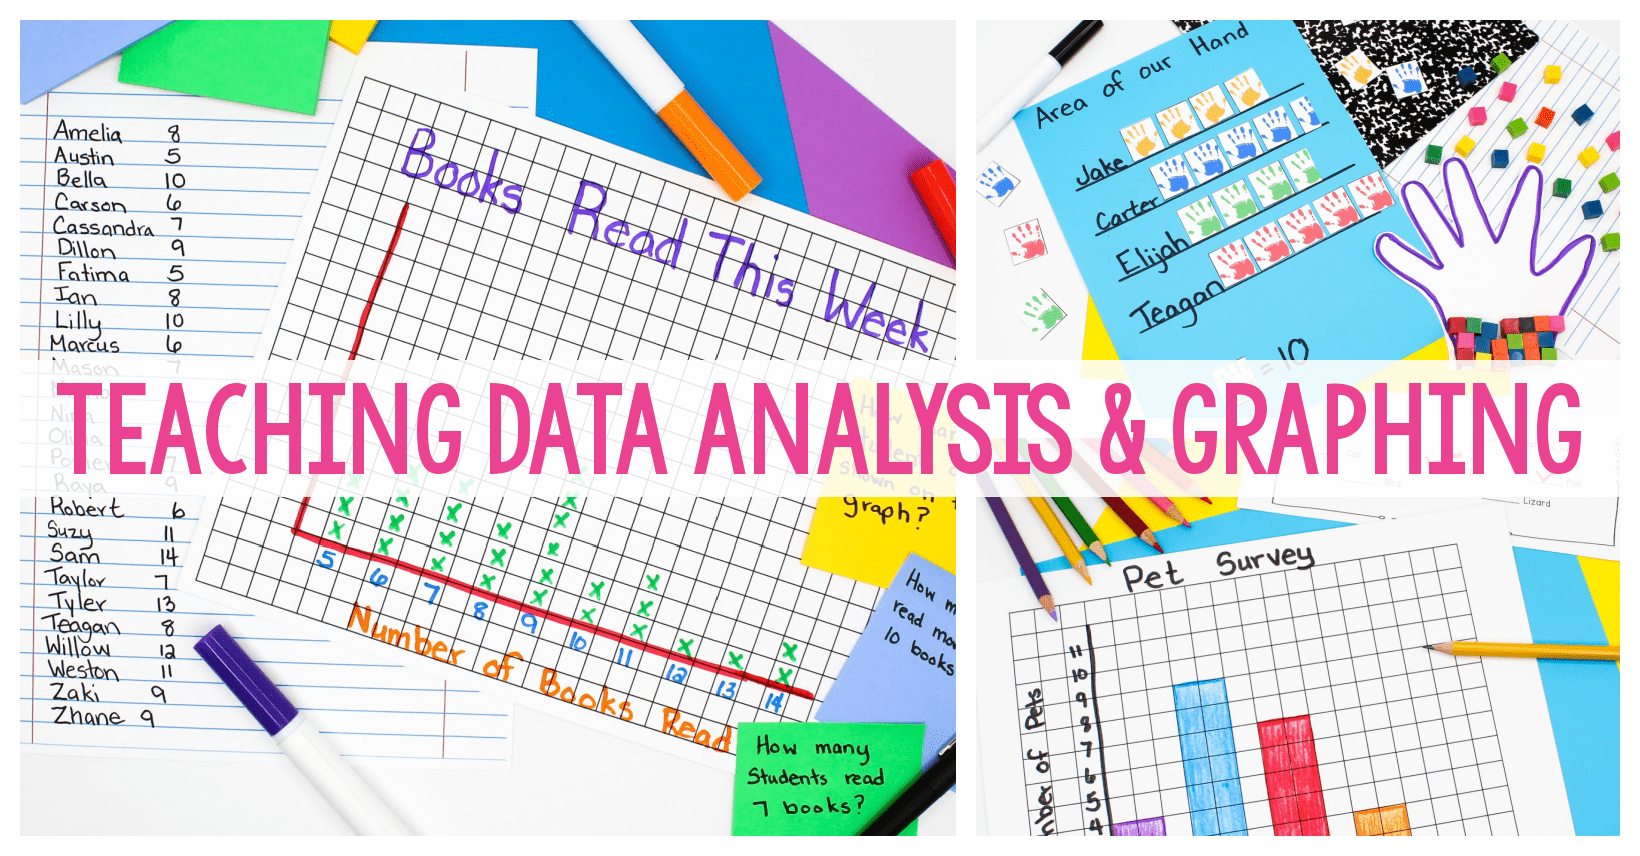
These graphing worksheets and activities are a huge help in my math instruction. I kind of don’t have a unit for teaching data analysis and graphing. Technically, I do have one (here it is), but I don’t teach it lesson by lesson. Instead, I incorporate the graphing worksheets and lessons within my other math units. The reason I do this isn’t because of some profound revelation in teaching math. Instead, it’s simply because I don’t have time for an isolated math unit.
I’ve found that the best way for me to teach data analysis and graphing is to integrate it in my other math units. This often results in me adding an additional lesson to each of my math units or embedding a lesson or two into our math centers. In this post, I’ll share some of the ways I teach data analysis through graphing worksheets and activities.
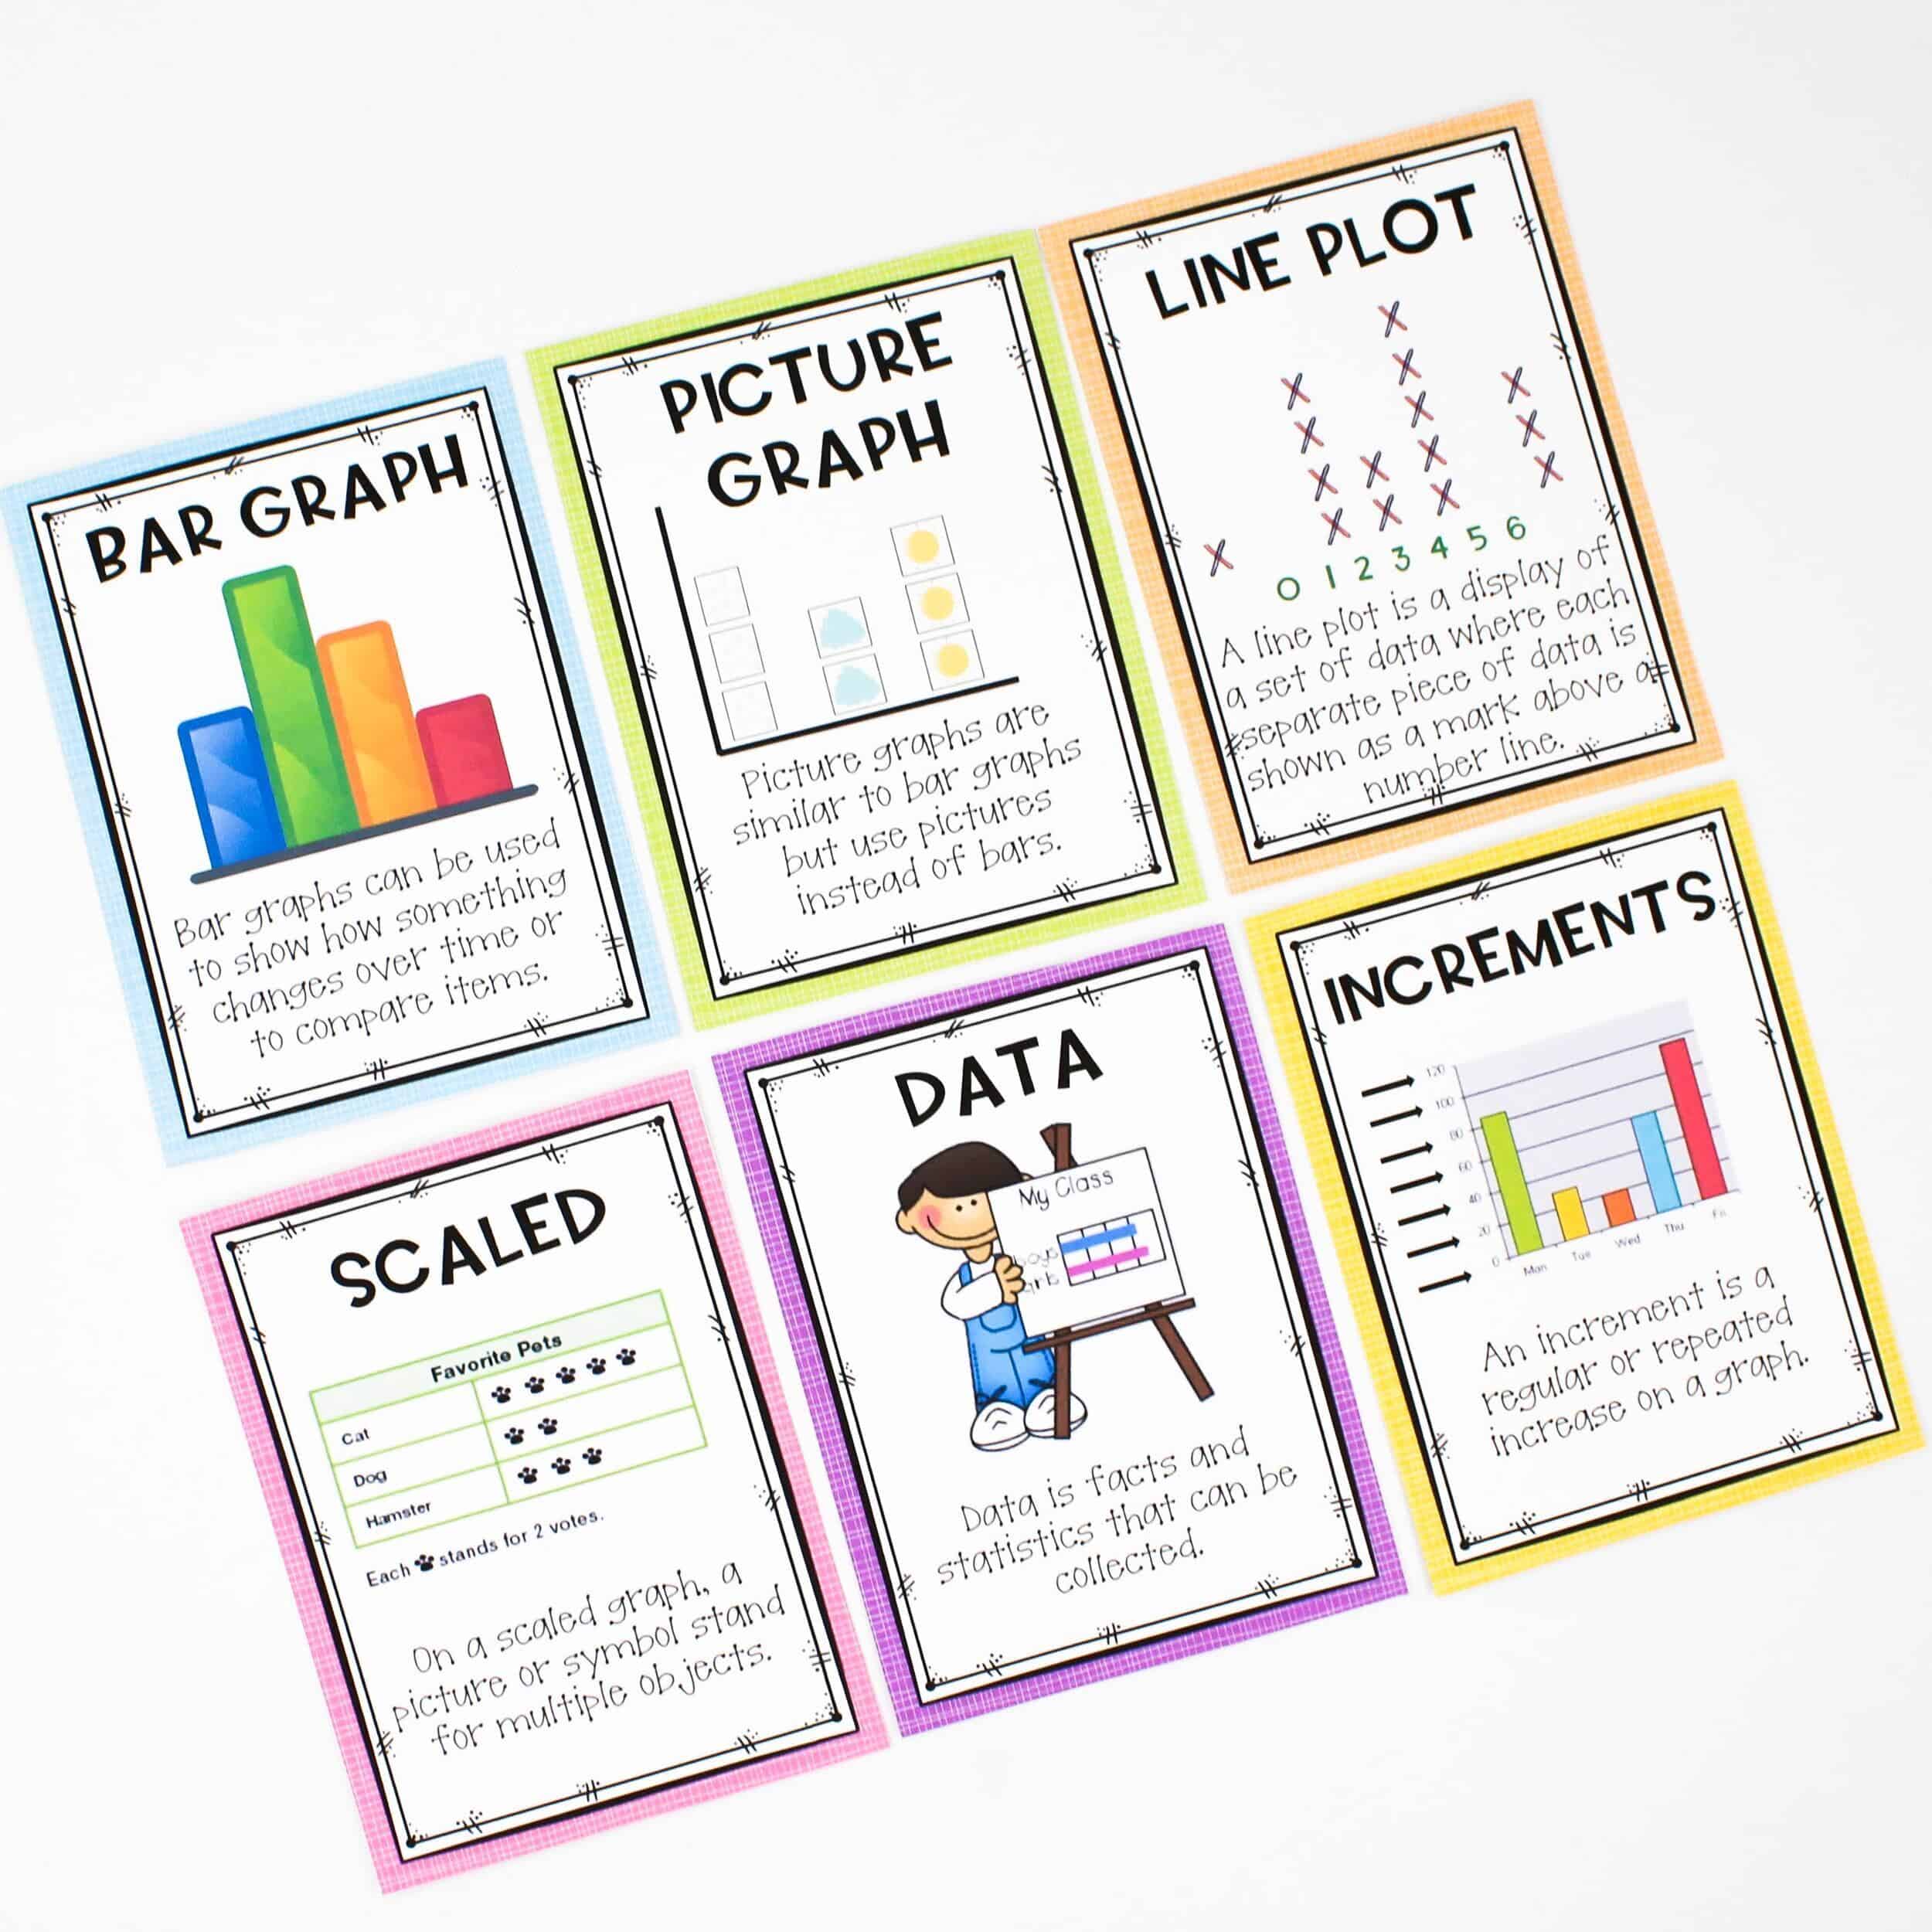
Graphing Vocabulary
I do make sure students know general graphing terms. Most of these are taught in the primary grades, so that aren’t completely new to students. If you feel the need to teach more basic graphic skills as a quick review, you can do something short and easy like this Favorite Flavor of Ice Cream lesson.
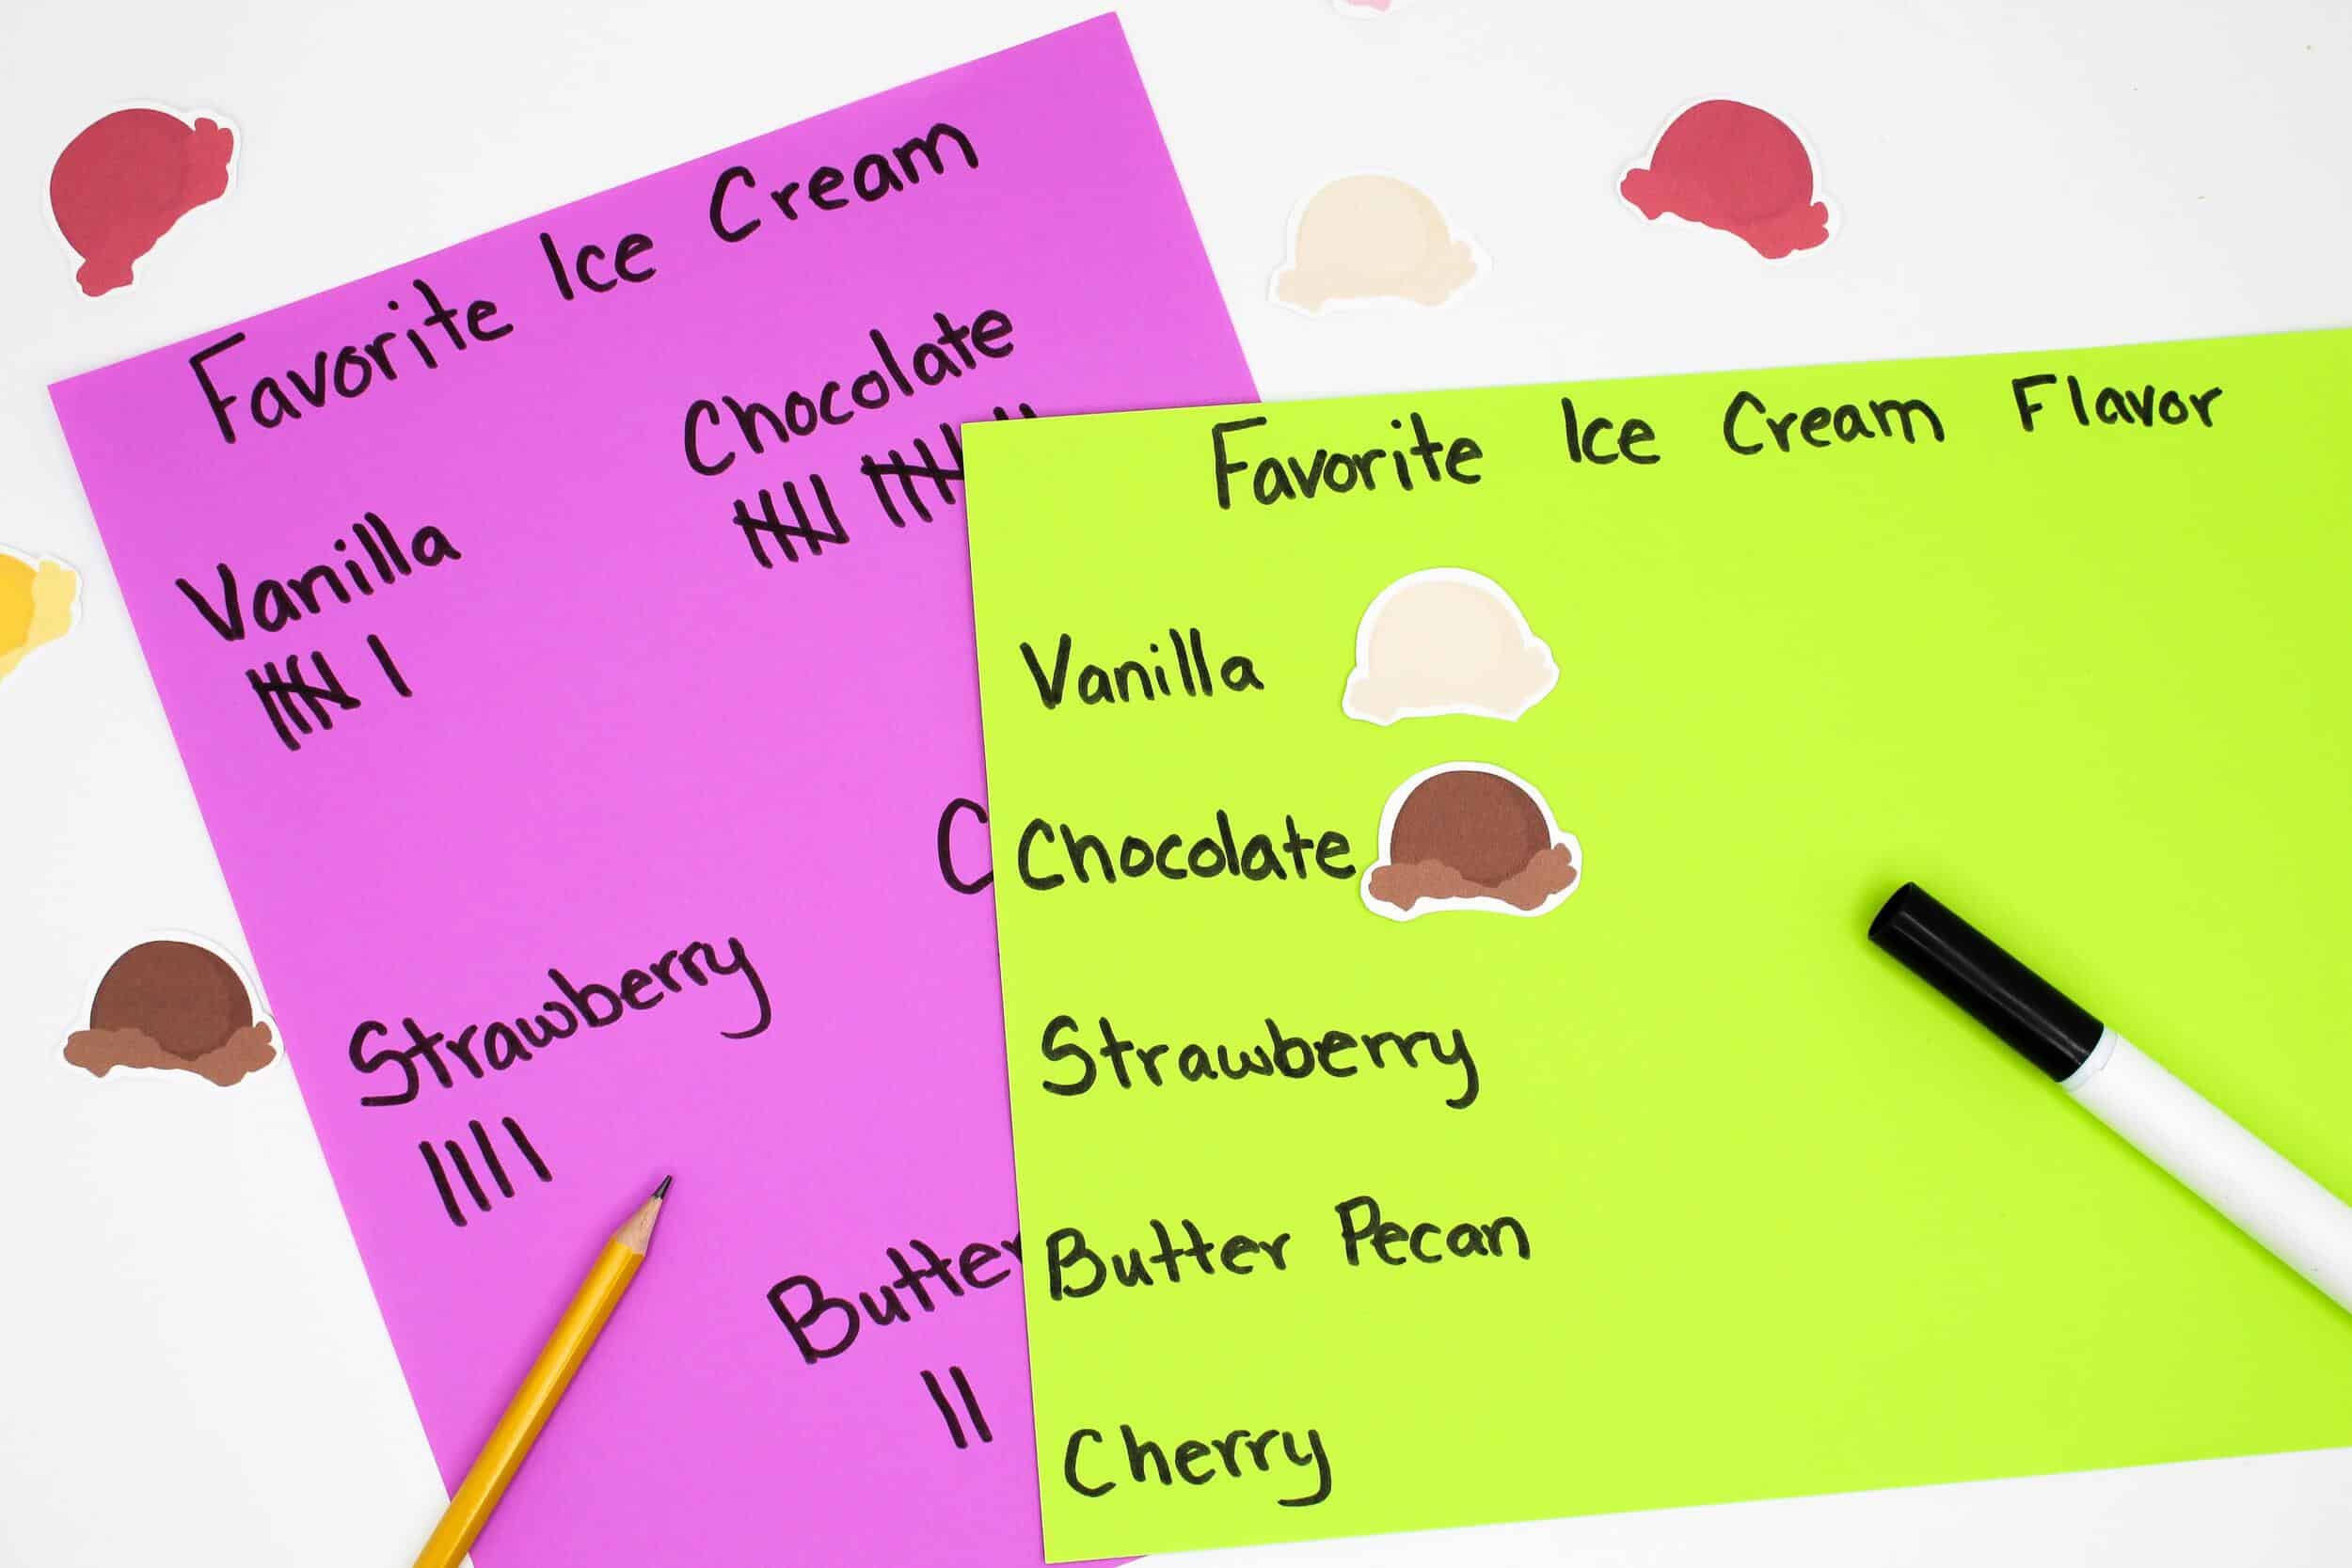
Students survey classmates and teachers on their favorite flavor of ice cream. Then, students use their tally chart to create a picture graph of the top ice cream flavors.
Another introductory lesson is the My Favorite Pet survey. This is a quick and easy graphing activity to review essential vocabulary and concepts.
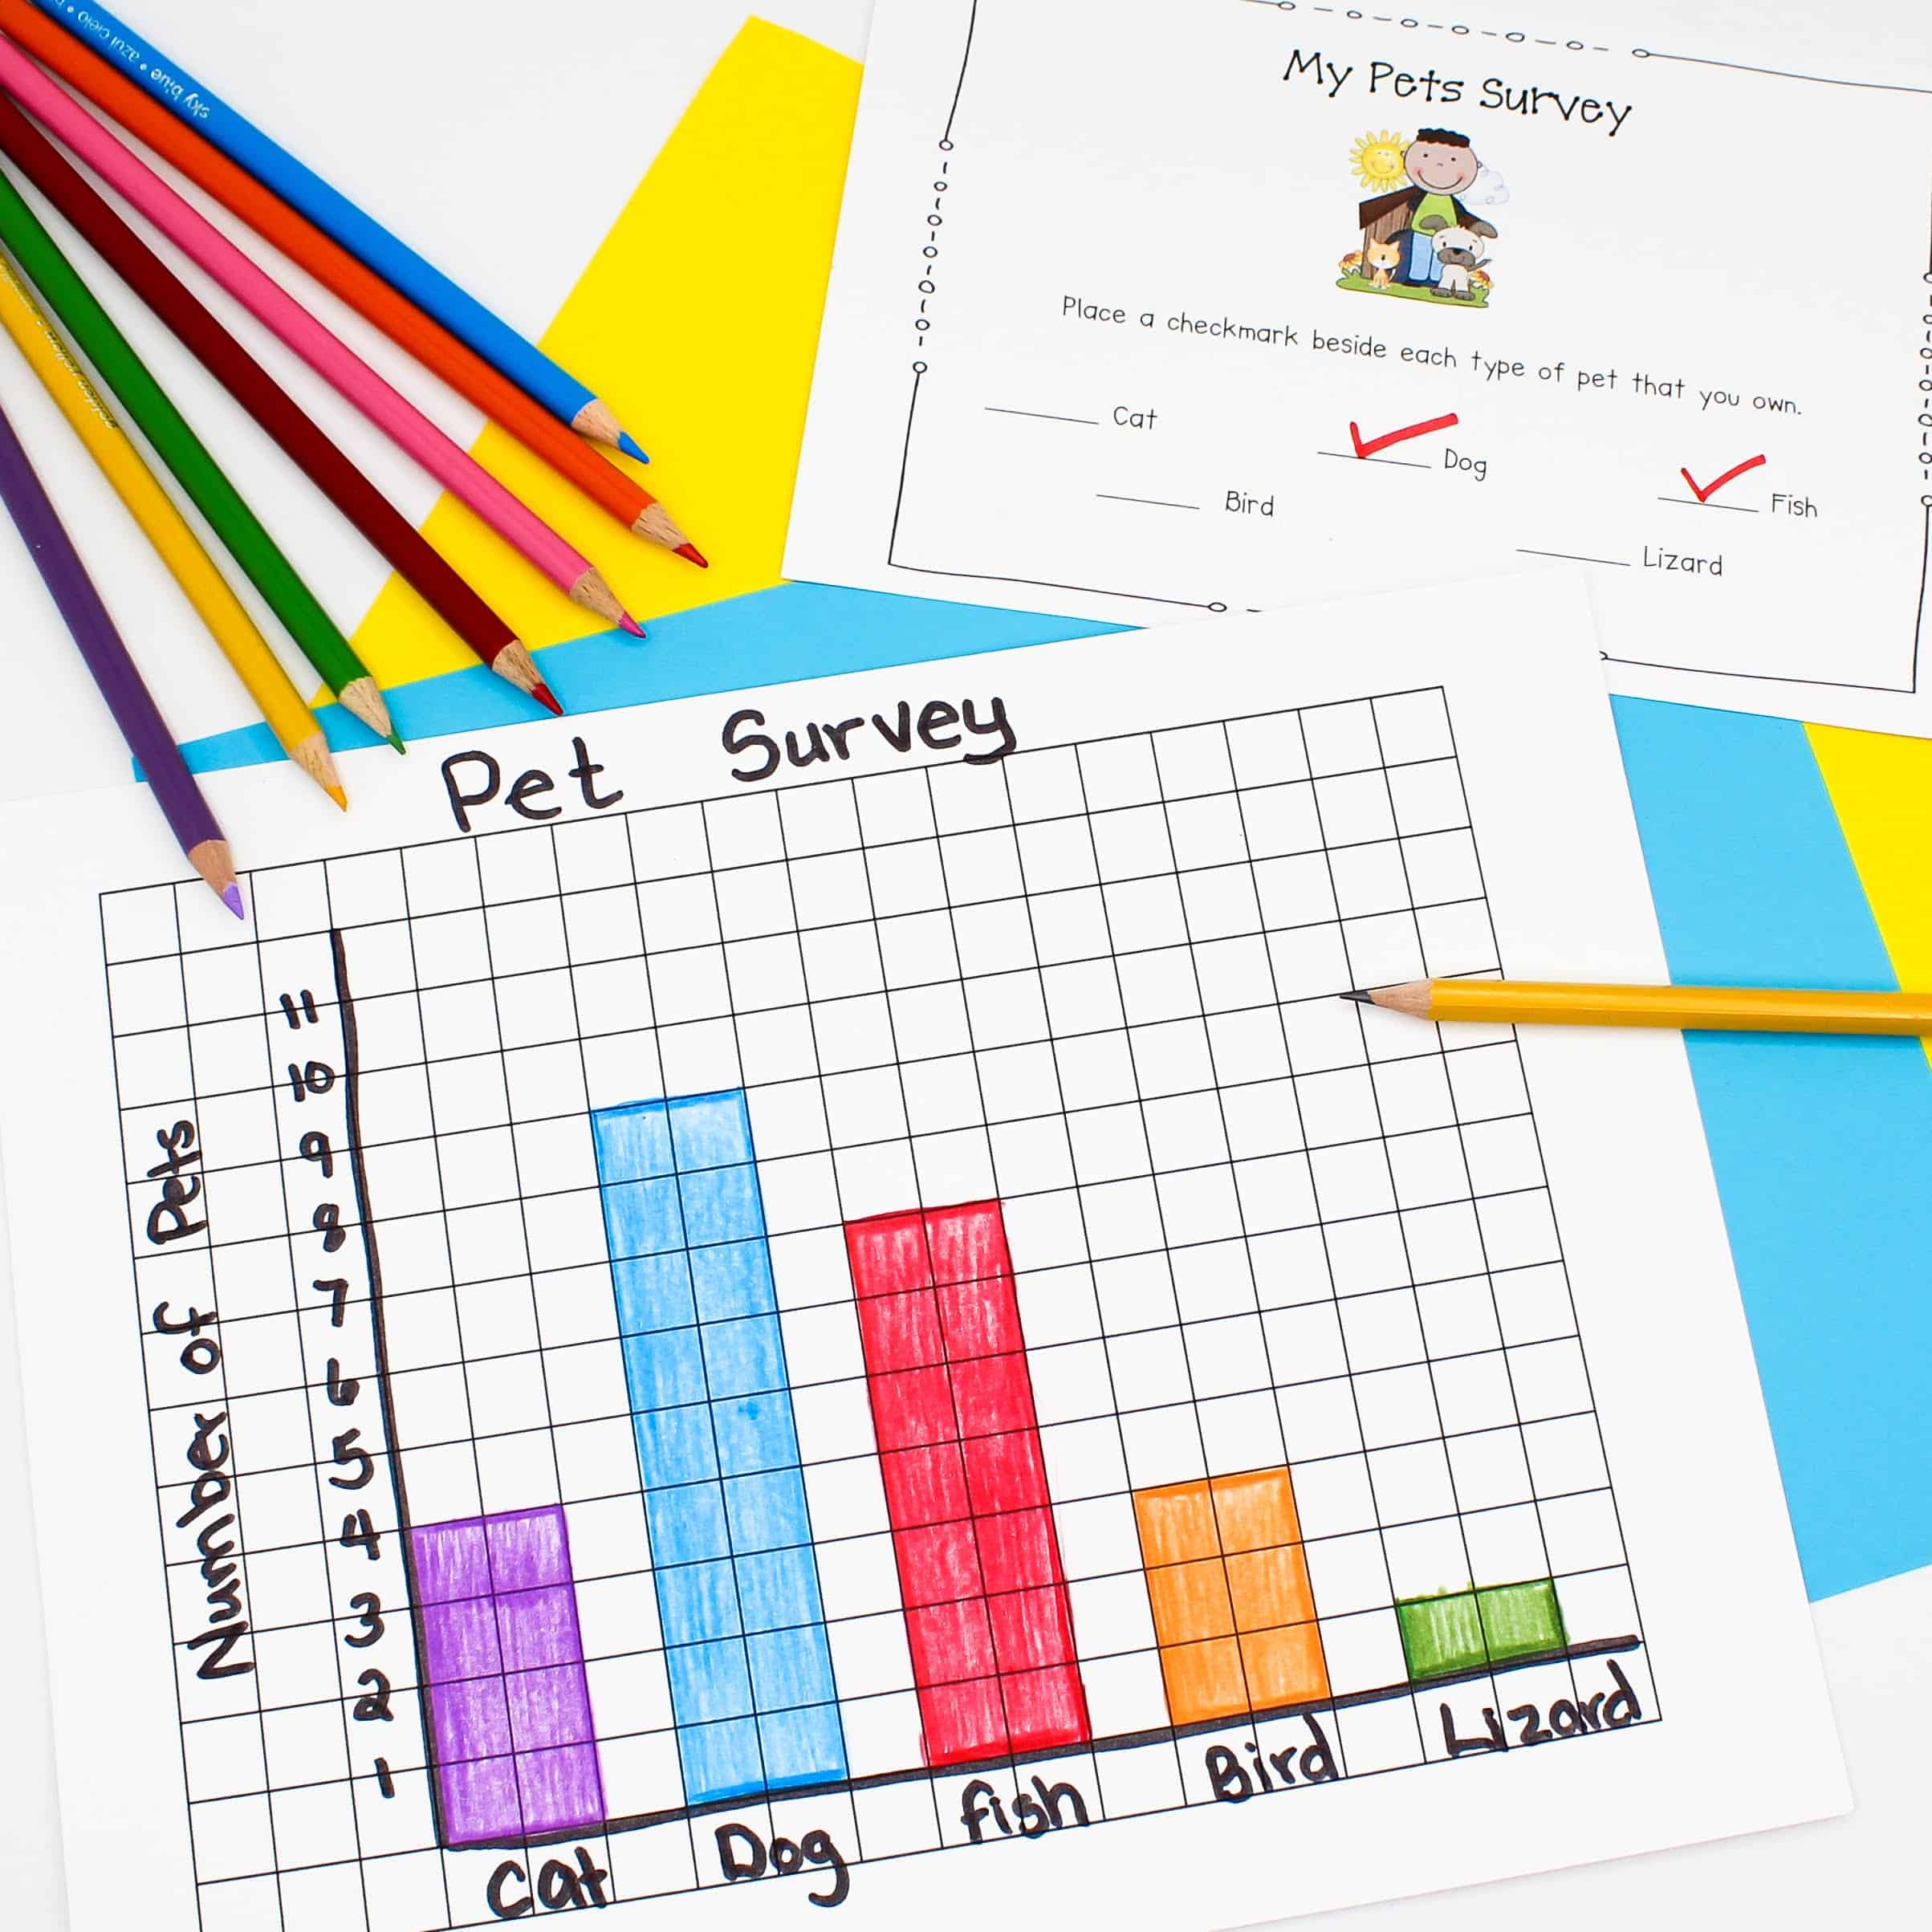
Once again, students interview peers and/or adults to determine their favorite pet. Then, students use that information to create a bar graph.
Line plots are most likely to be new to students, so this is one introductory lesson I don’t skip. (BTW-These names, as always, are totally made-up. While I do teach these lessons, all names and student work are made outside my actual classroom.)
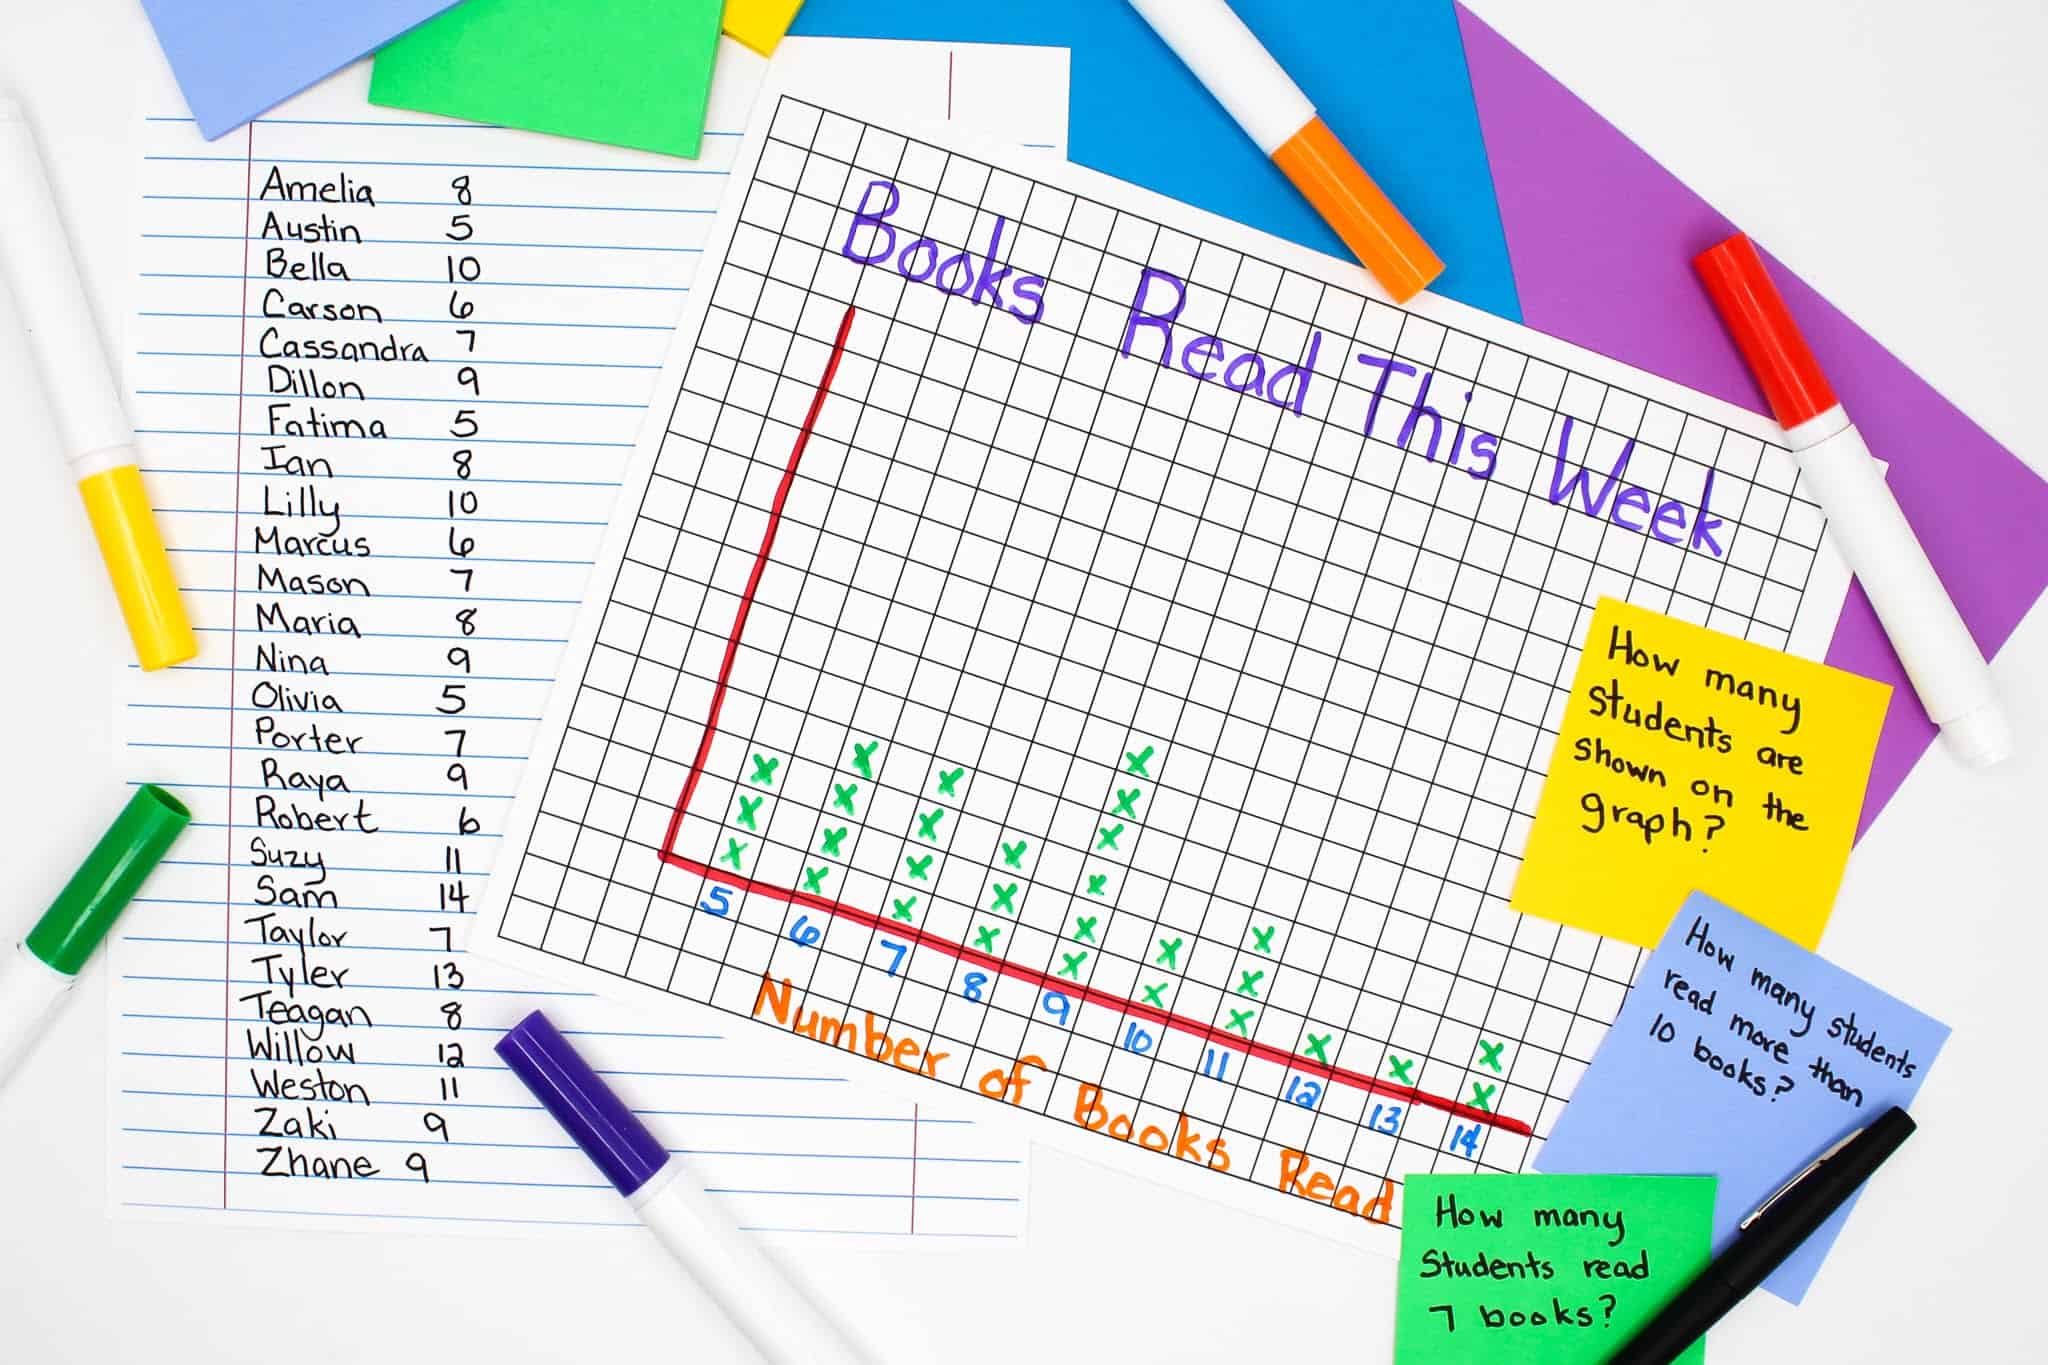
In this graphing worksheet, we list how many hours a week, books a week, or even hours a month students read. Then, students make a line plot to represent the information. It’s helpful for students to create their line plots on graph paper, because it helps them keep their Xs lined up correctly.
Graphing Worksheets – Place Value
One way to incorporate place value and teaching data analysis is through the Place Value Tower activity, which is an incredibly fun graphing worksheet.
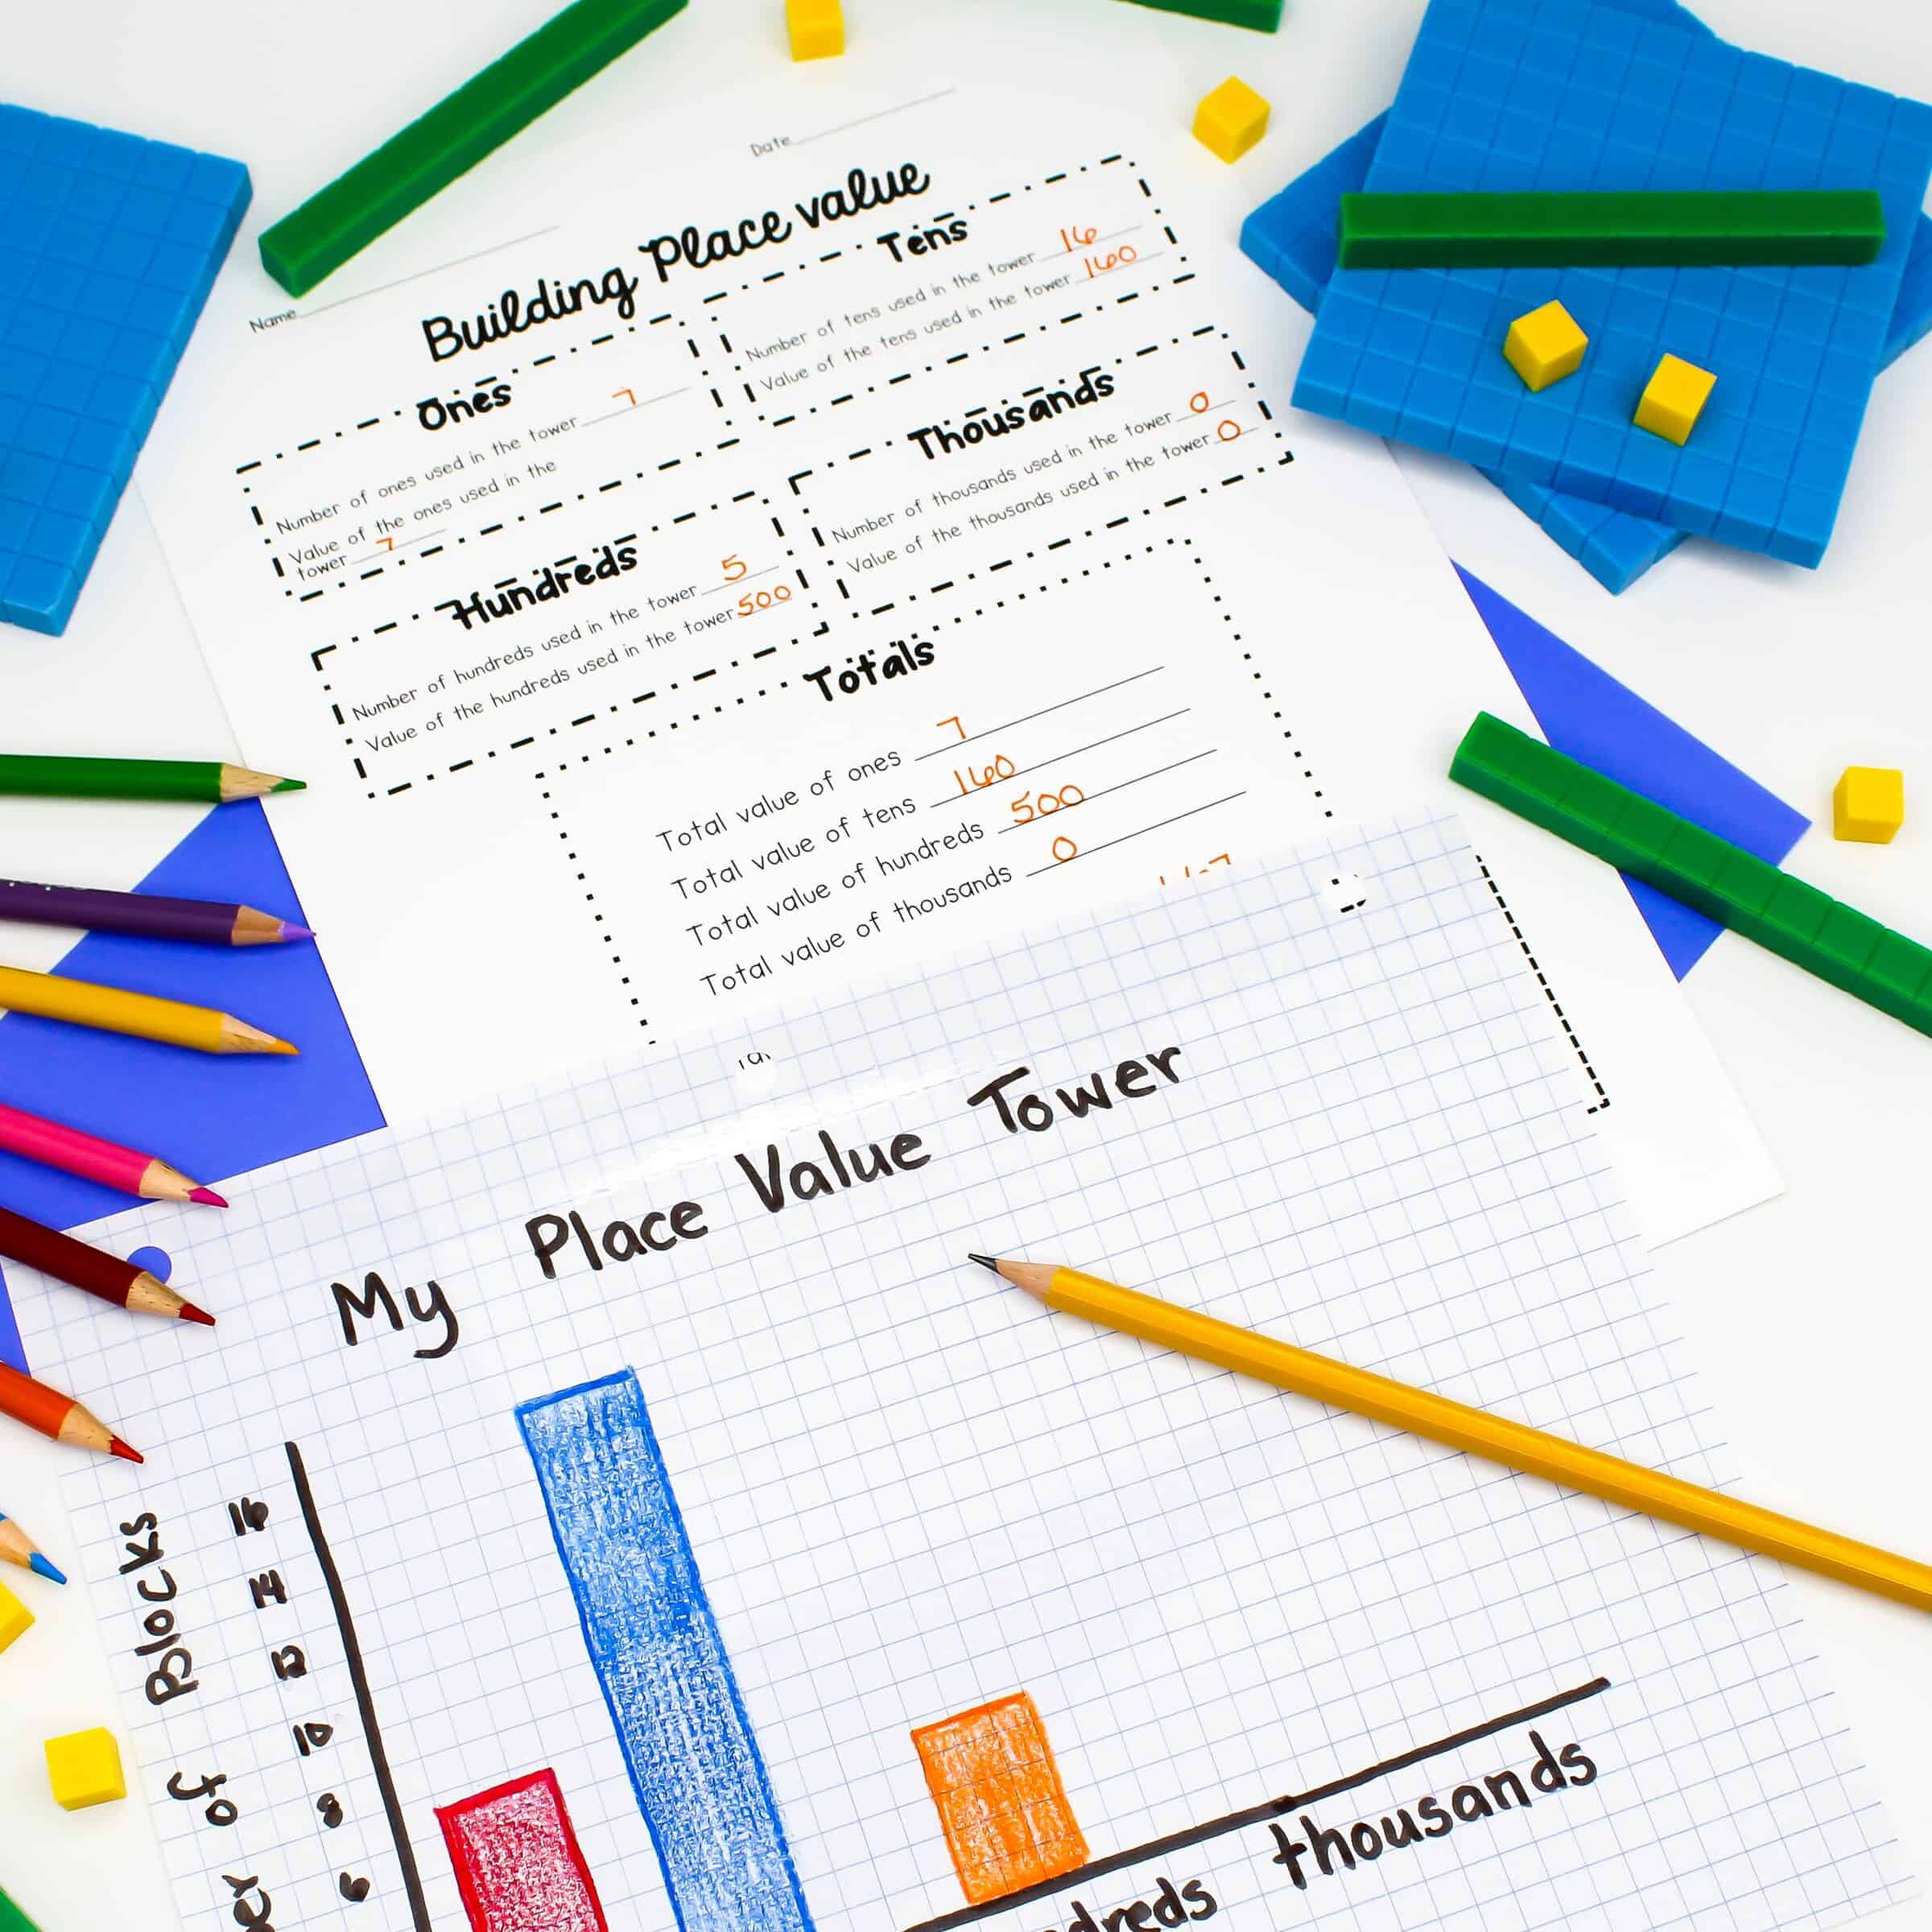
Students build a “Place Value Tower” out of base-ten blocks. Then, they determine the total value of the base-ten blocks, as well as graph the number of one, tens, hundreds, and thousands blocks used to build the tower. To incorporate graphing, have students create a bar graph to either show the total number of ones, tens, hundreds, and thousands blocks in their Place Value Tower, or create a bar graph to show the total value of ones, tens, hundreds, and thousands in their Place Value Tower.
Graphing Worksheets – Addition and Subtraction
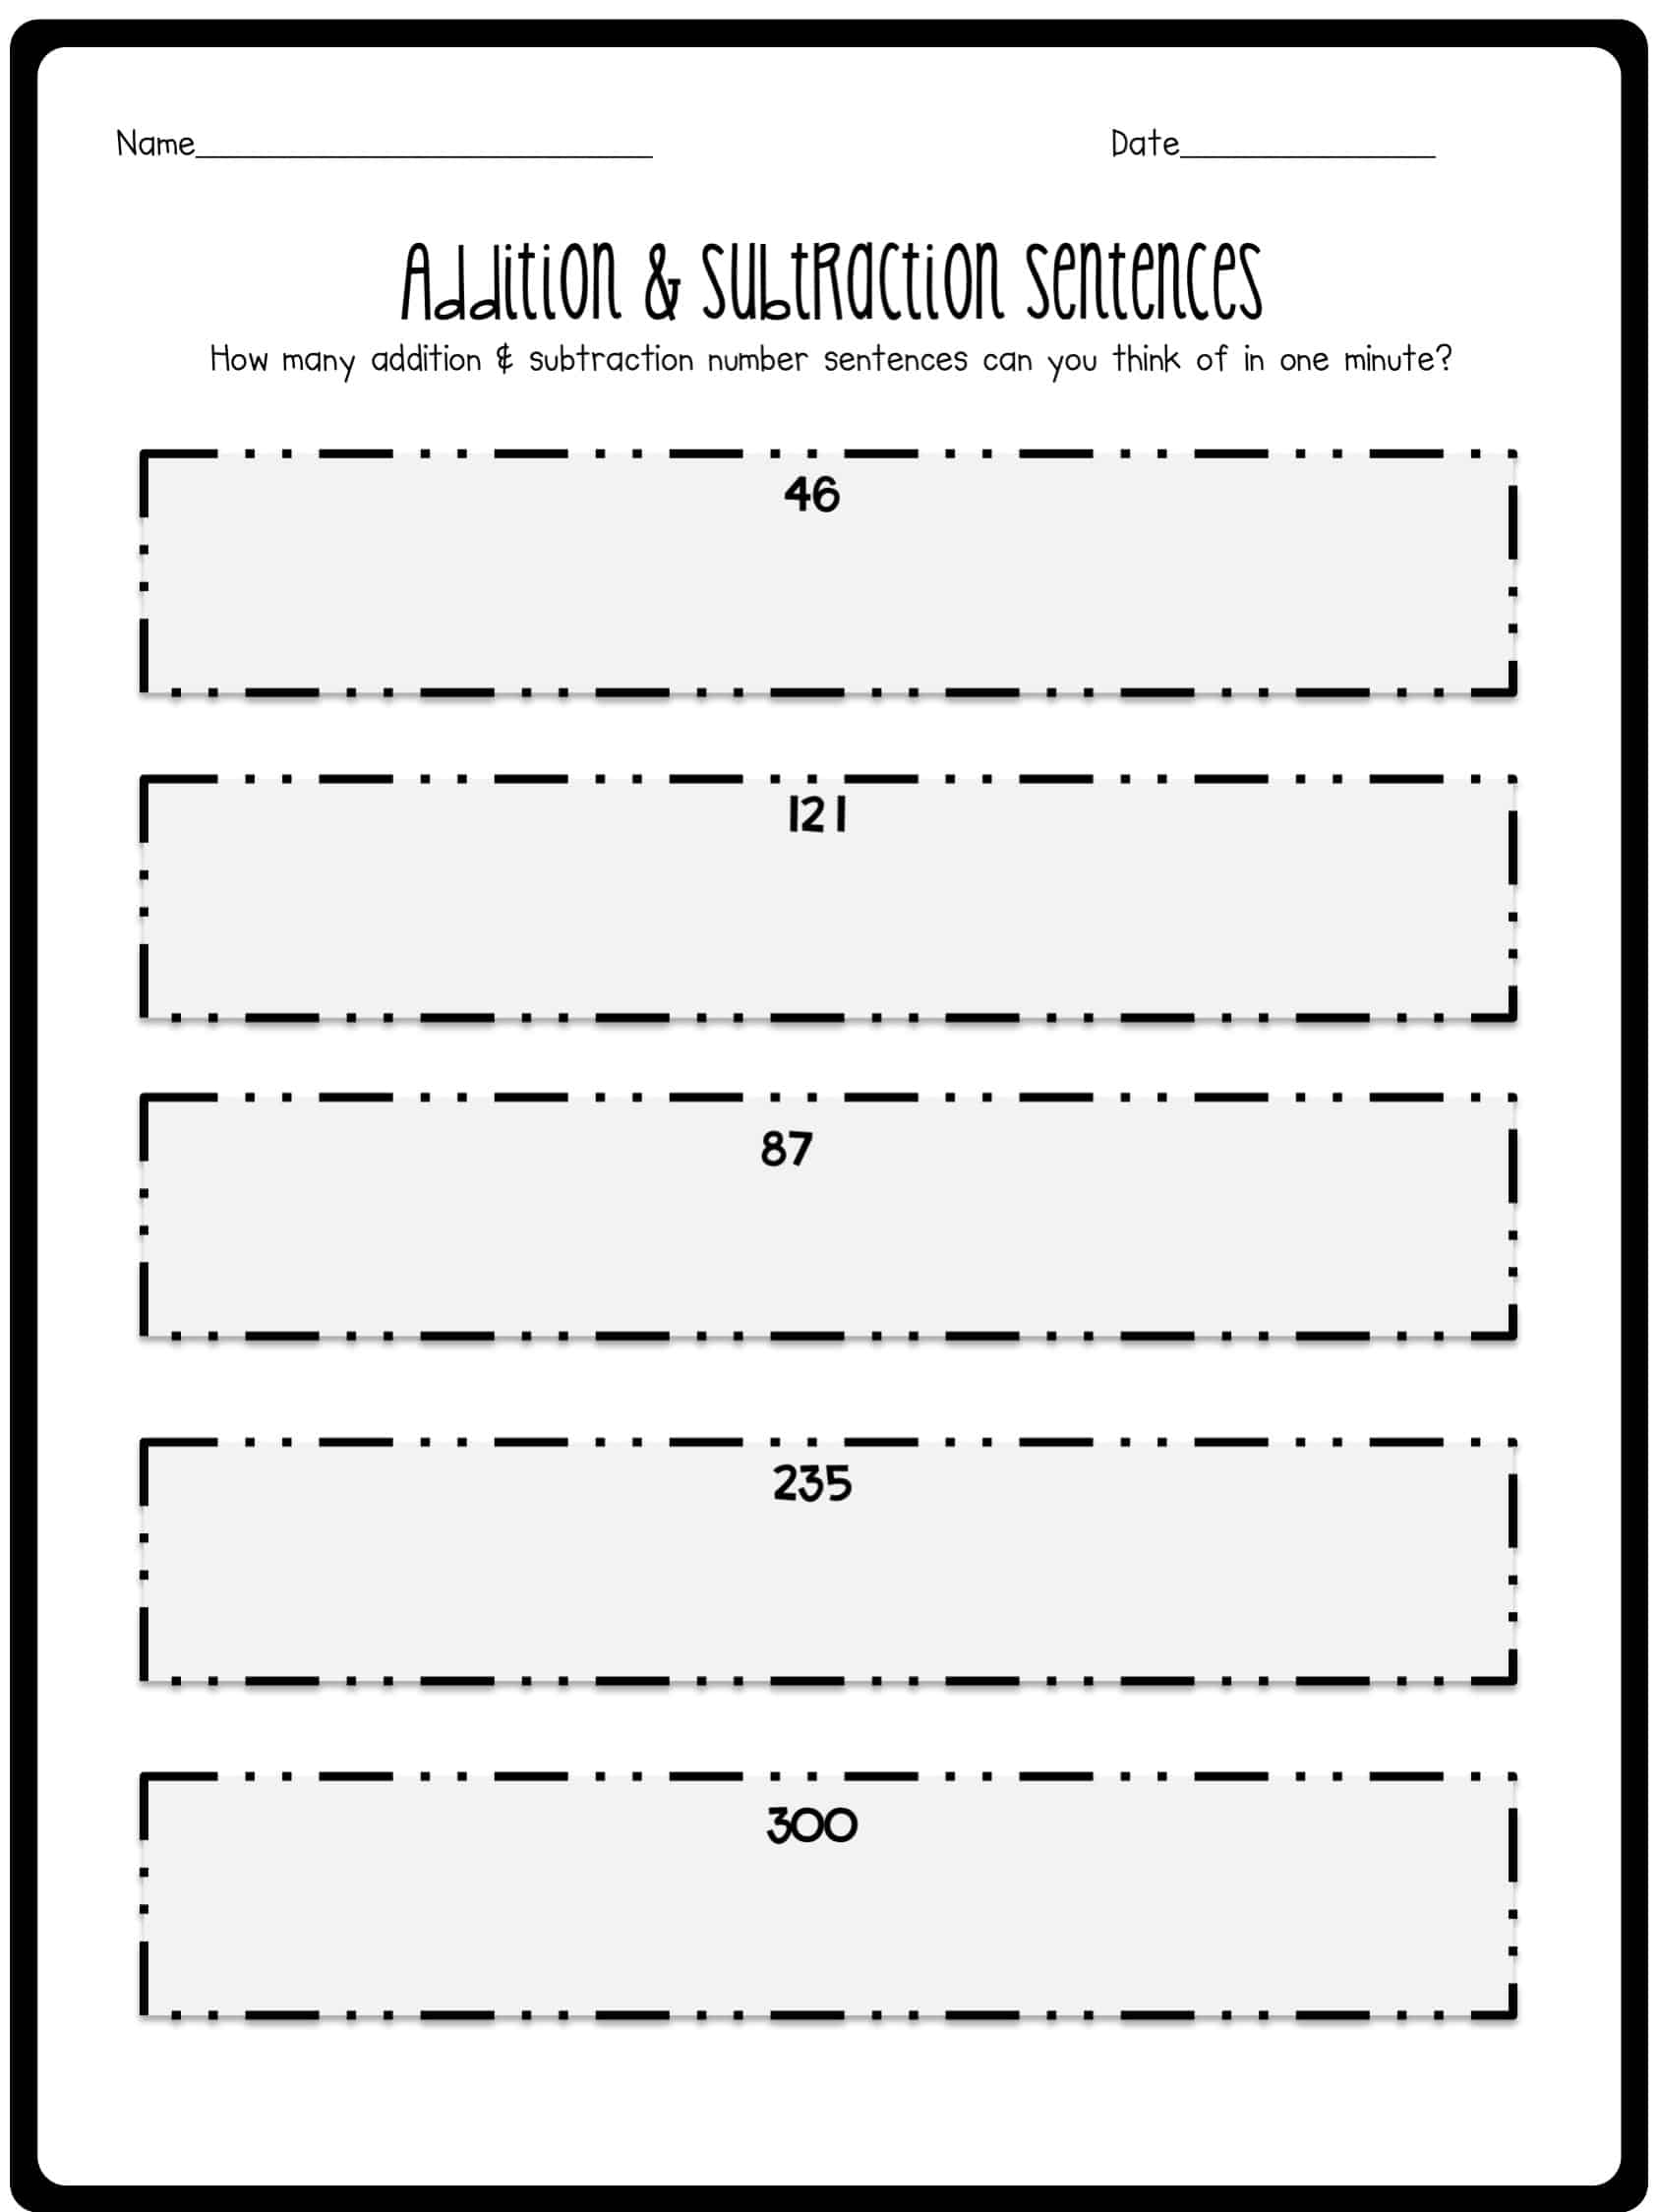
In this graphing worksheet, students think of as many addition and subtraction number sentences as possible that equal a given number. (If you did this later in the year, you could use multiplication.) I like to give my students a one minute time limit for each number, and depending on the group and their need for a challenge, I may add rules such as: you can only use each digit once or you have to use 2-digit numbers.
After students have played five rounds, they complete a line plot that indicates how many number sentences they were able to generate during each round.
Math Facts
This is a great way to have students track their progress in learning multiplication or division facts. This is not a one time graphing assignment, but rather a graphing tool that students can use to monitor their own learning. I have students complete this graph independently and don’t display the graphs, so students do not compare their results with each other.
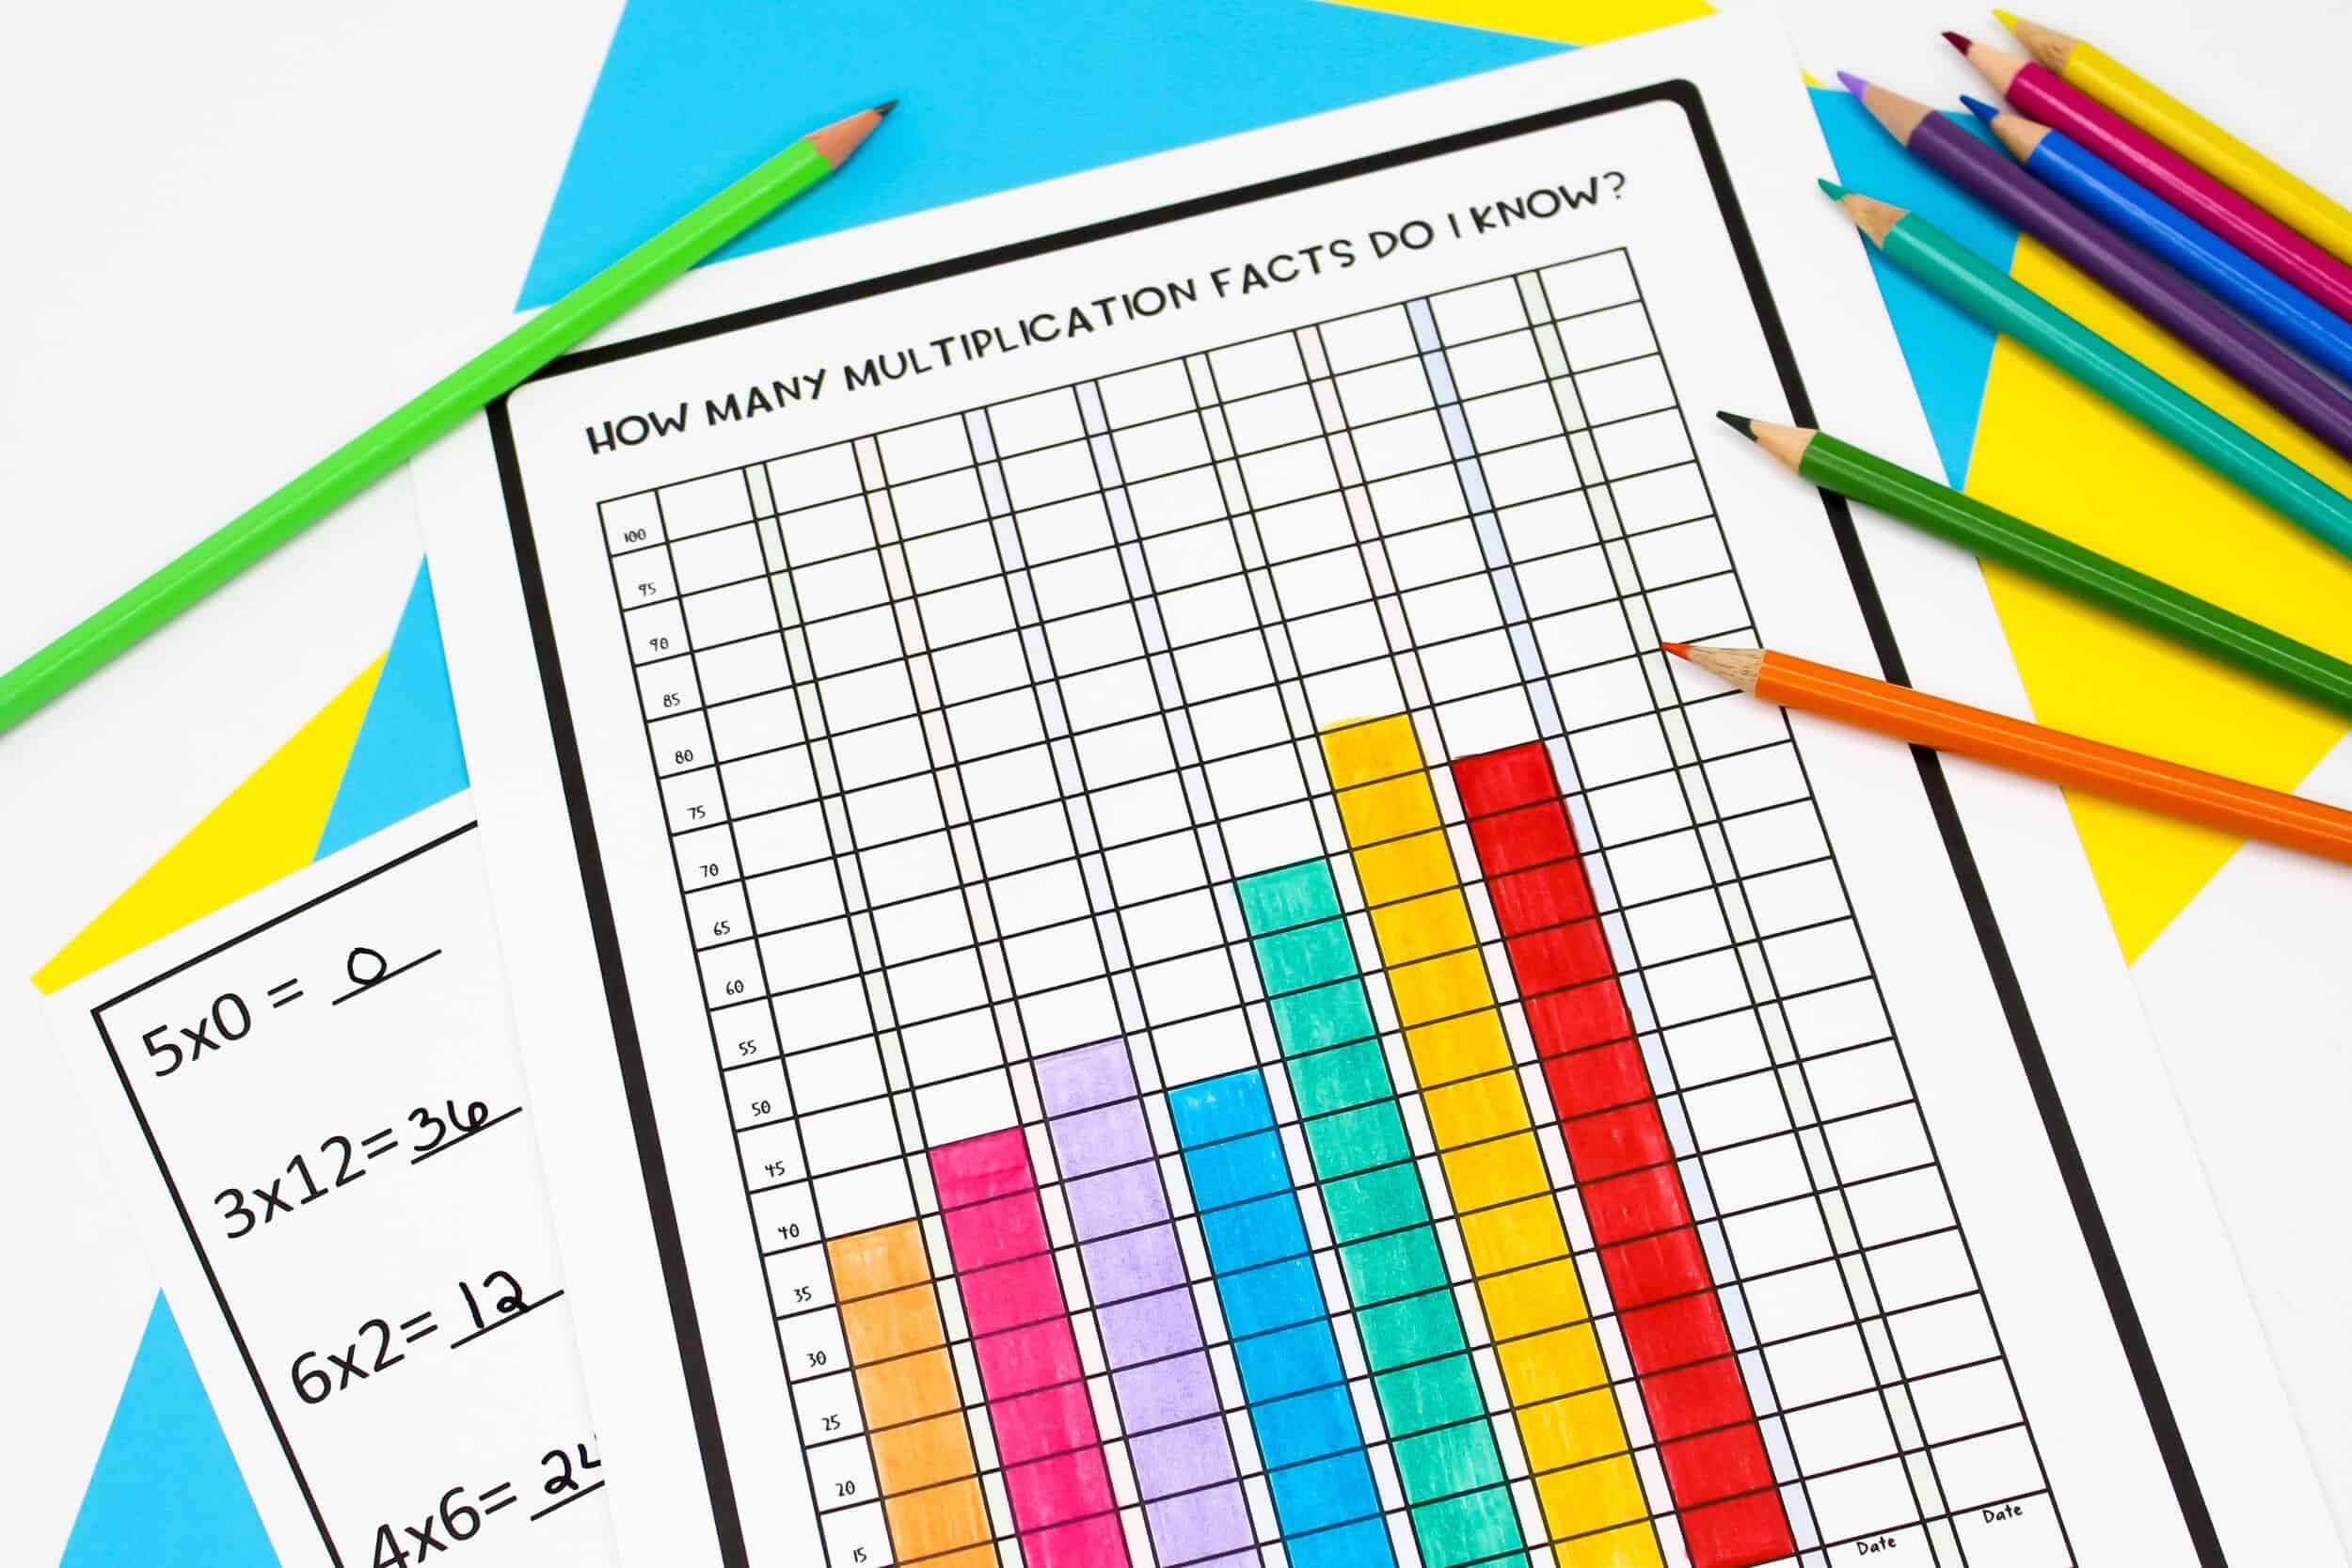
Once a week, every other week, once a month, or any set time period, give students a 100 question multiplication or division quiz. If you use Option 2, and feel like 100 questions is too much for your students, you can absolutely reduce the number of questions! It’s just important to keep the number consistent, so that graph accurately displays the data.
- Option 1-Count how many questions students answered correctly during the 5 minute test.
- Option 2-To reduce the anxiety of having a timed test, have students take as long as they need to solve the math facts. Rather than recording the number of problems correct in a minute, record the number of minutes and seconds needed to complete the math quiz.
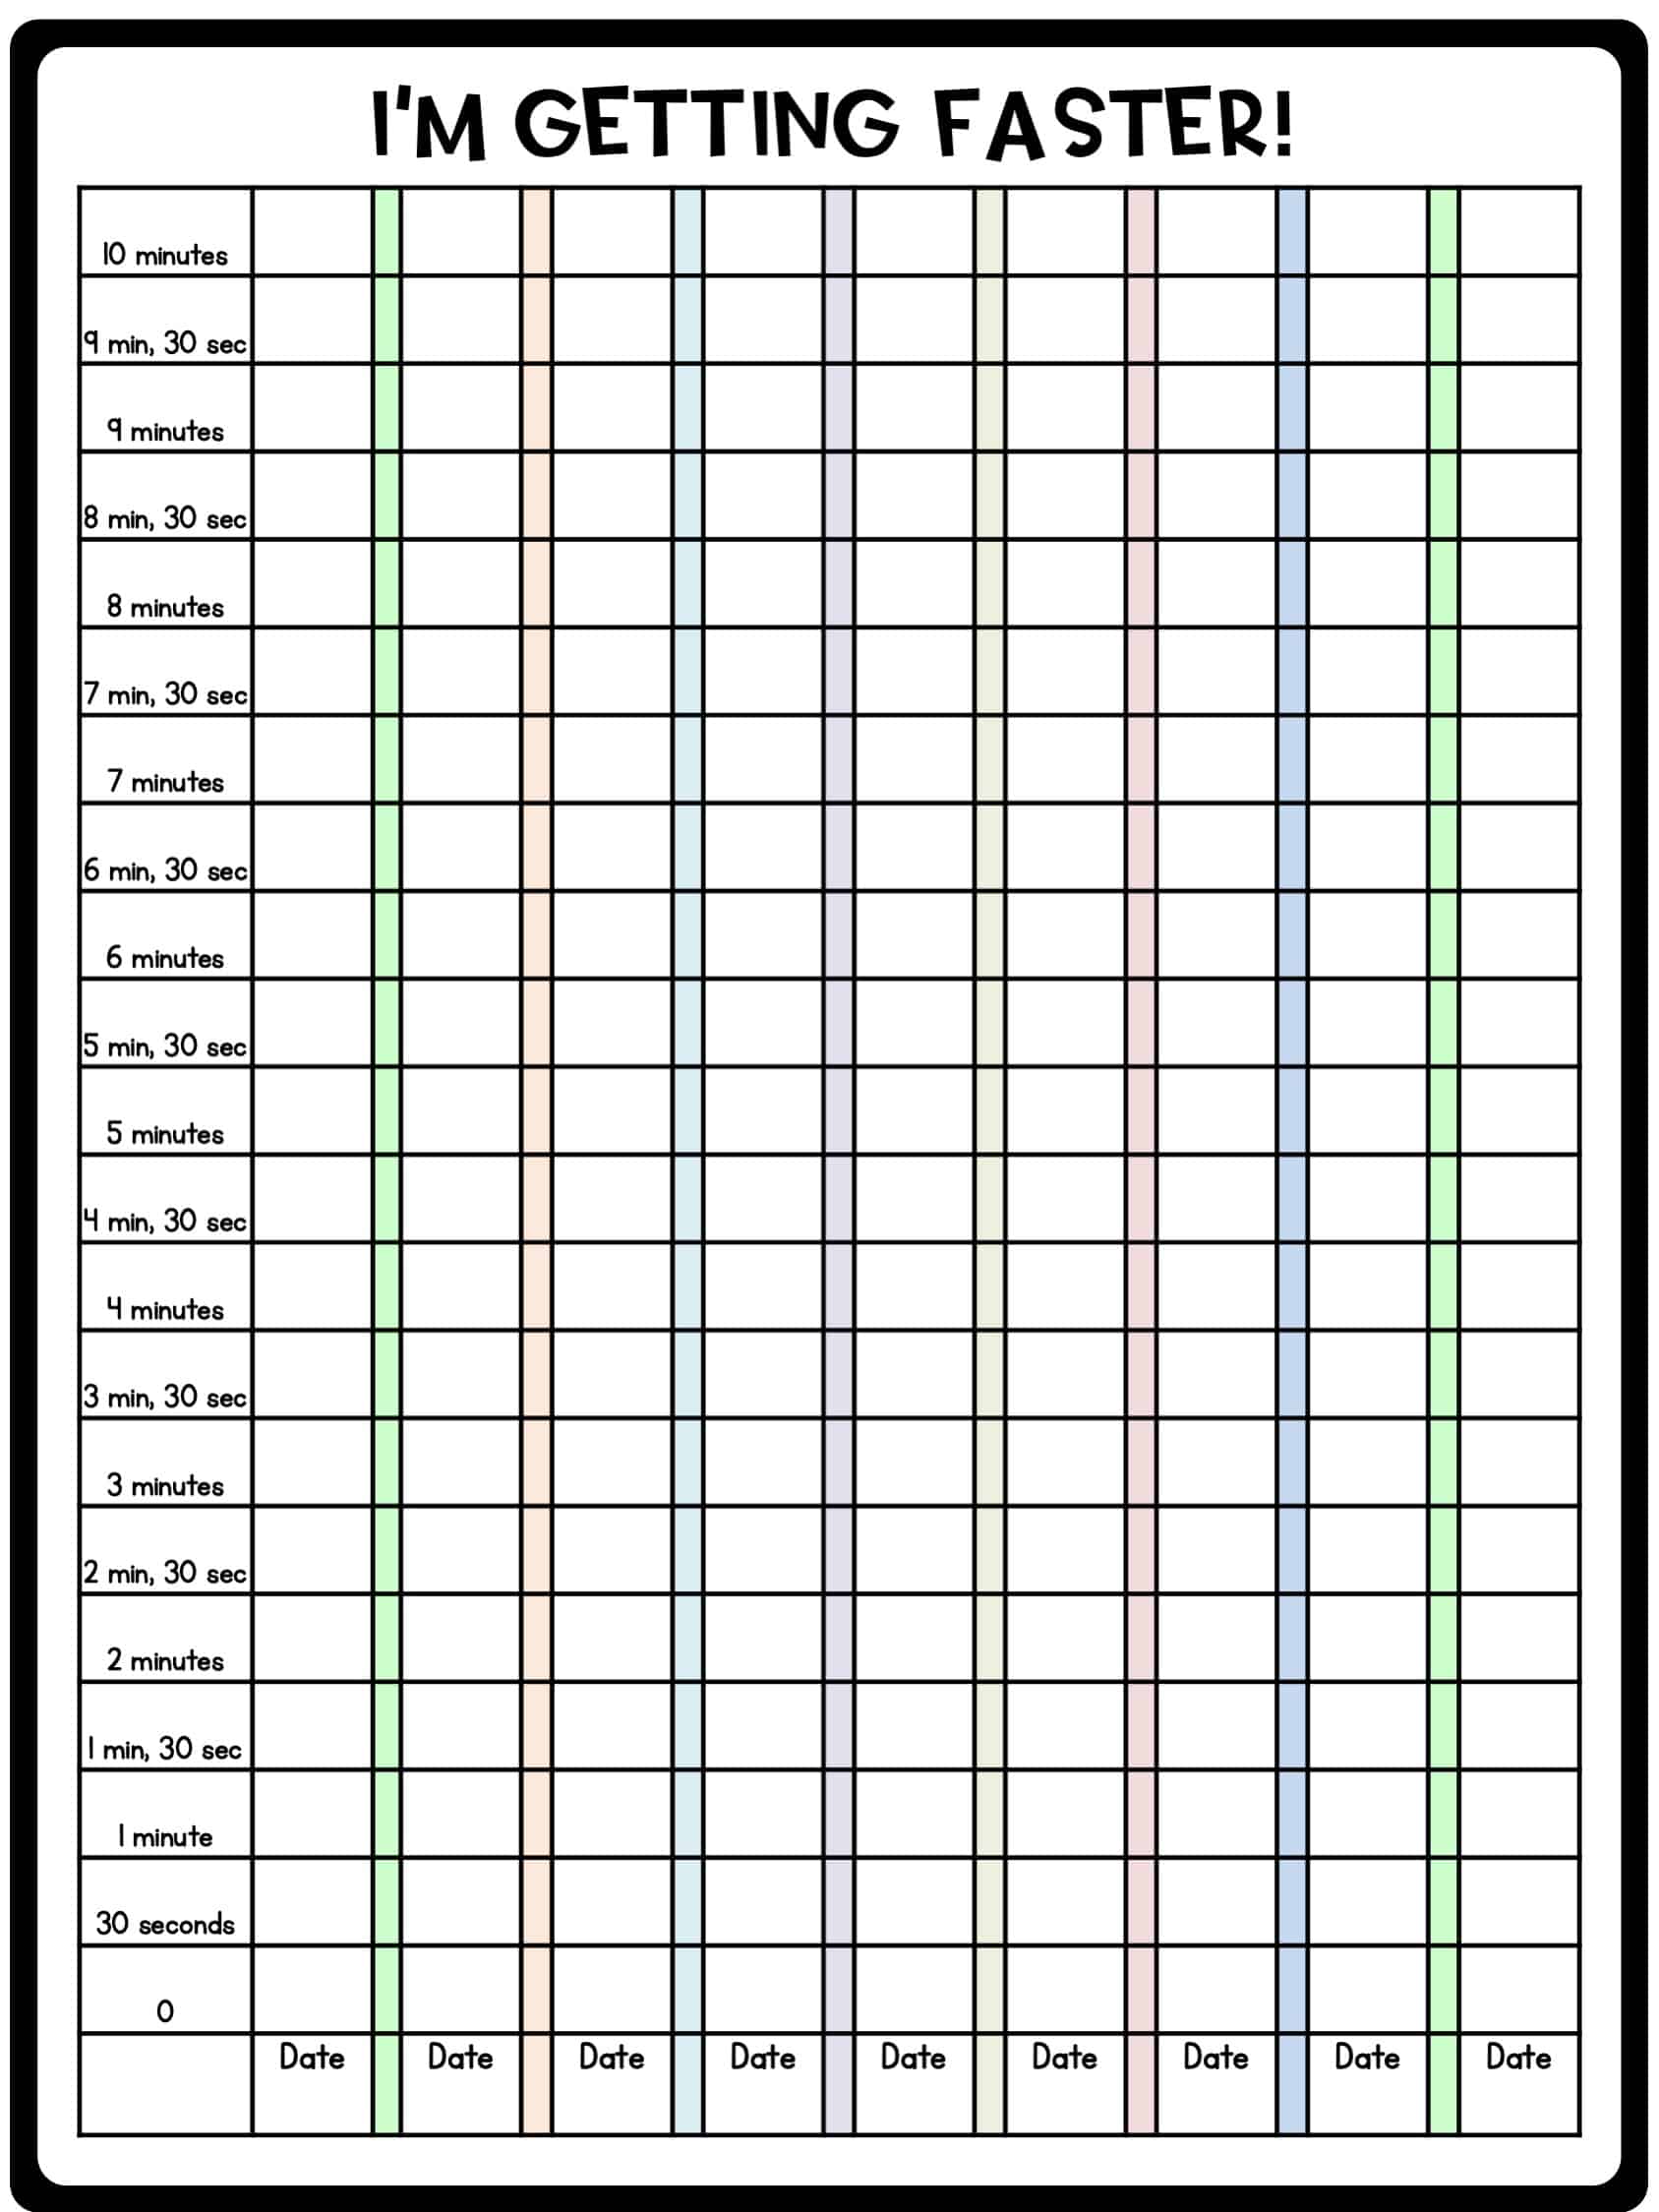
Have students complete one section of the bar graph after each time they complete the assessment. Use the data to encourage students to focus on growth and not perfection.
Graphing Worksheets – Multiplication
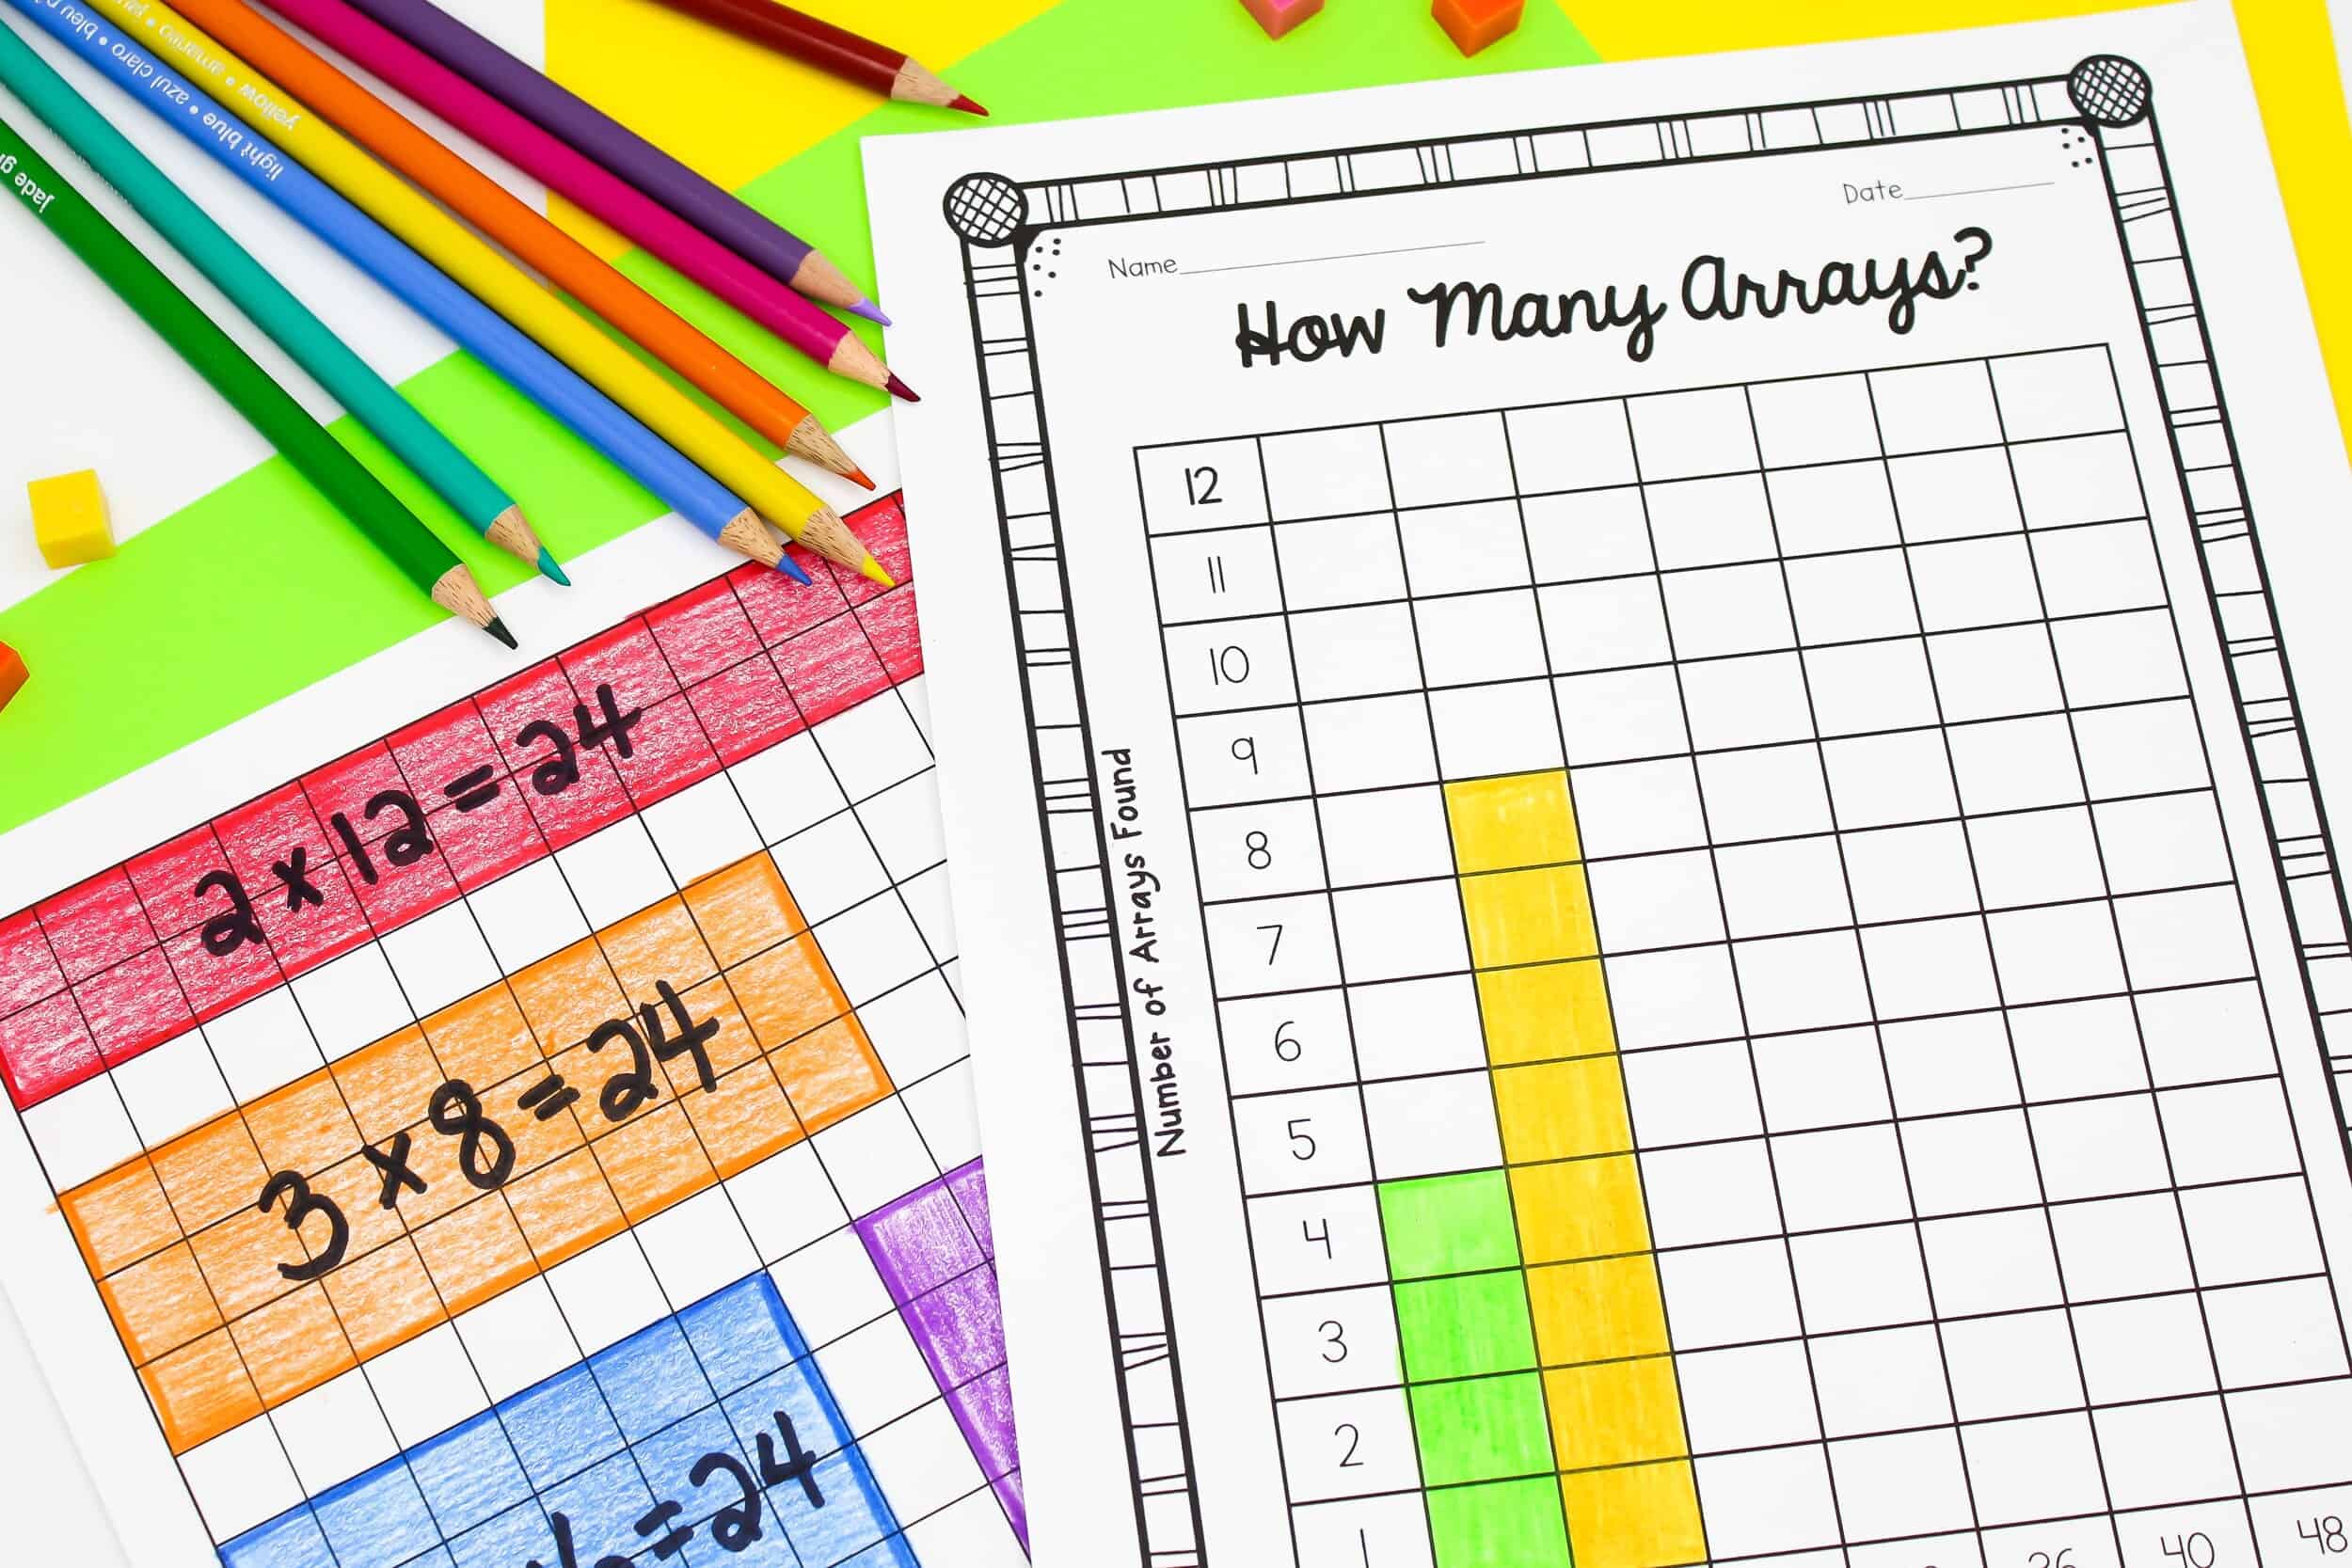
This array lesson can be taught after students have experience reading and creating arrays. In this activity, students build all of the arrays possible seven different numbers. They record their arrays on grid paper and write a multiplication equation for each array. Once students have found all of the arrays possible, they create a bar graph to show how many arrays were found for each number.
Elapsed Time
Have students complete the Where Does the Time Go survey independently. The survey asks students to estimate how many minutes they spend each day reading, watching television, playing video games, playing outside, helping around the house, and practicing an activity such as sports or a musical instrument.
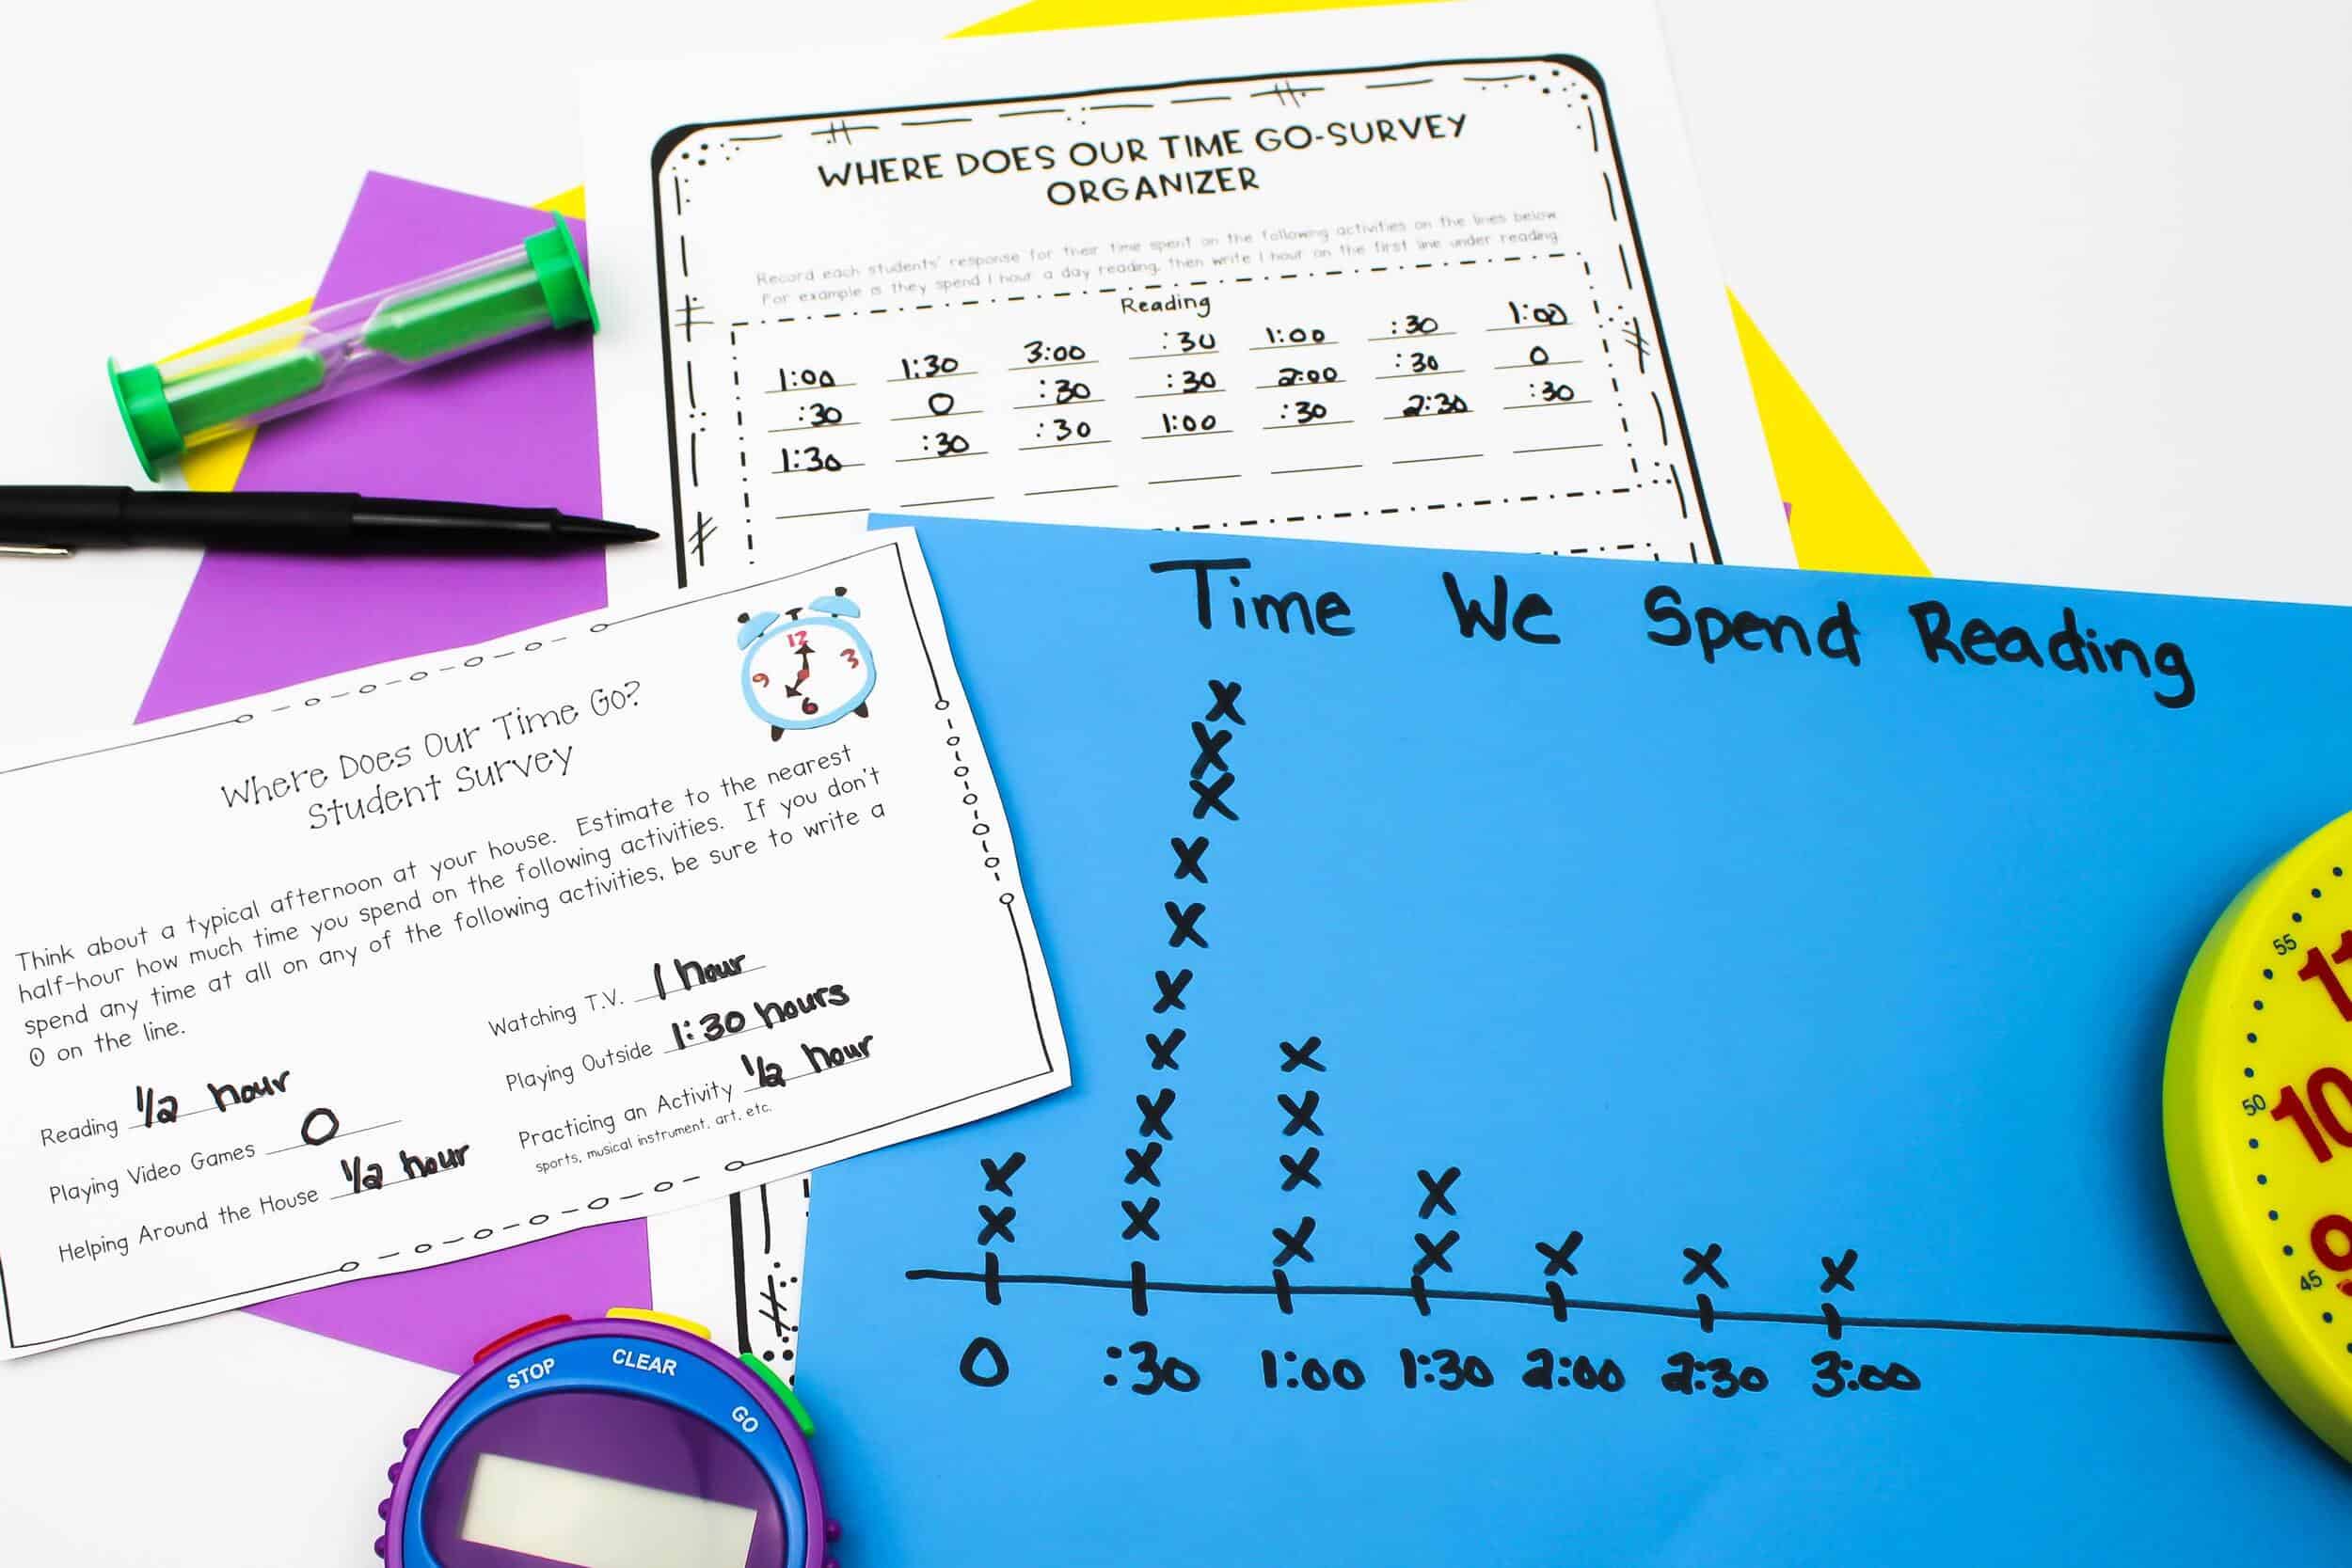
Use the survey organizer to collect and display students’ data from the Student Survey. This organizer will allow students to consolidate the data and see the data as a whole. Then, have students work in groups to create a line plot that displays the data from one of the activities from the survey. Have students create their line plots on chart paper, so it can easily be viewed around the classroom.
After each group has completed their line plot, post the line plots in a central location and meet back together as a whole group to discuss the data represented in the line plots. The results are usually very surprising to students, and this is a great time to discuss goals and how it is important to use our time wisely to help us achieve our goals.
Fractions
Before beginning this lesson, students should multiple experiences using a ruler. Have students use a ruler to measure the length of ten pencils to the nearest ¼ inch and record their measurements. Then, have students create a line plot to show the length of each pencil measured.
You can complete a similar activity with paper airplanes and tie that into a STEM lesson. Give students time to create their paper airplanes and a few minutes to practice flying their airplanes. Break students into groups of four and have students take turns measuring the distance each plane flies. Each group needs masking tape to mark the starting and end point, a ruler to measure the flight, and a recording sheet. Then have students use the data in their recording sheet and the other groups’ recording sheets to create a line plot representing the data.
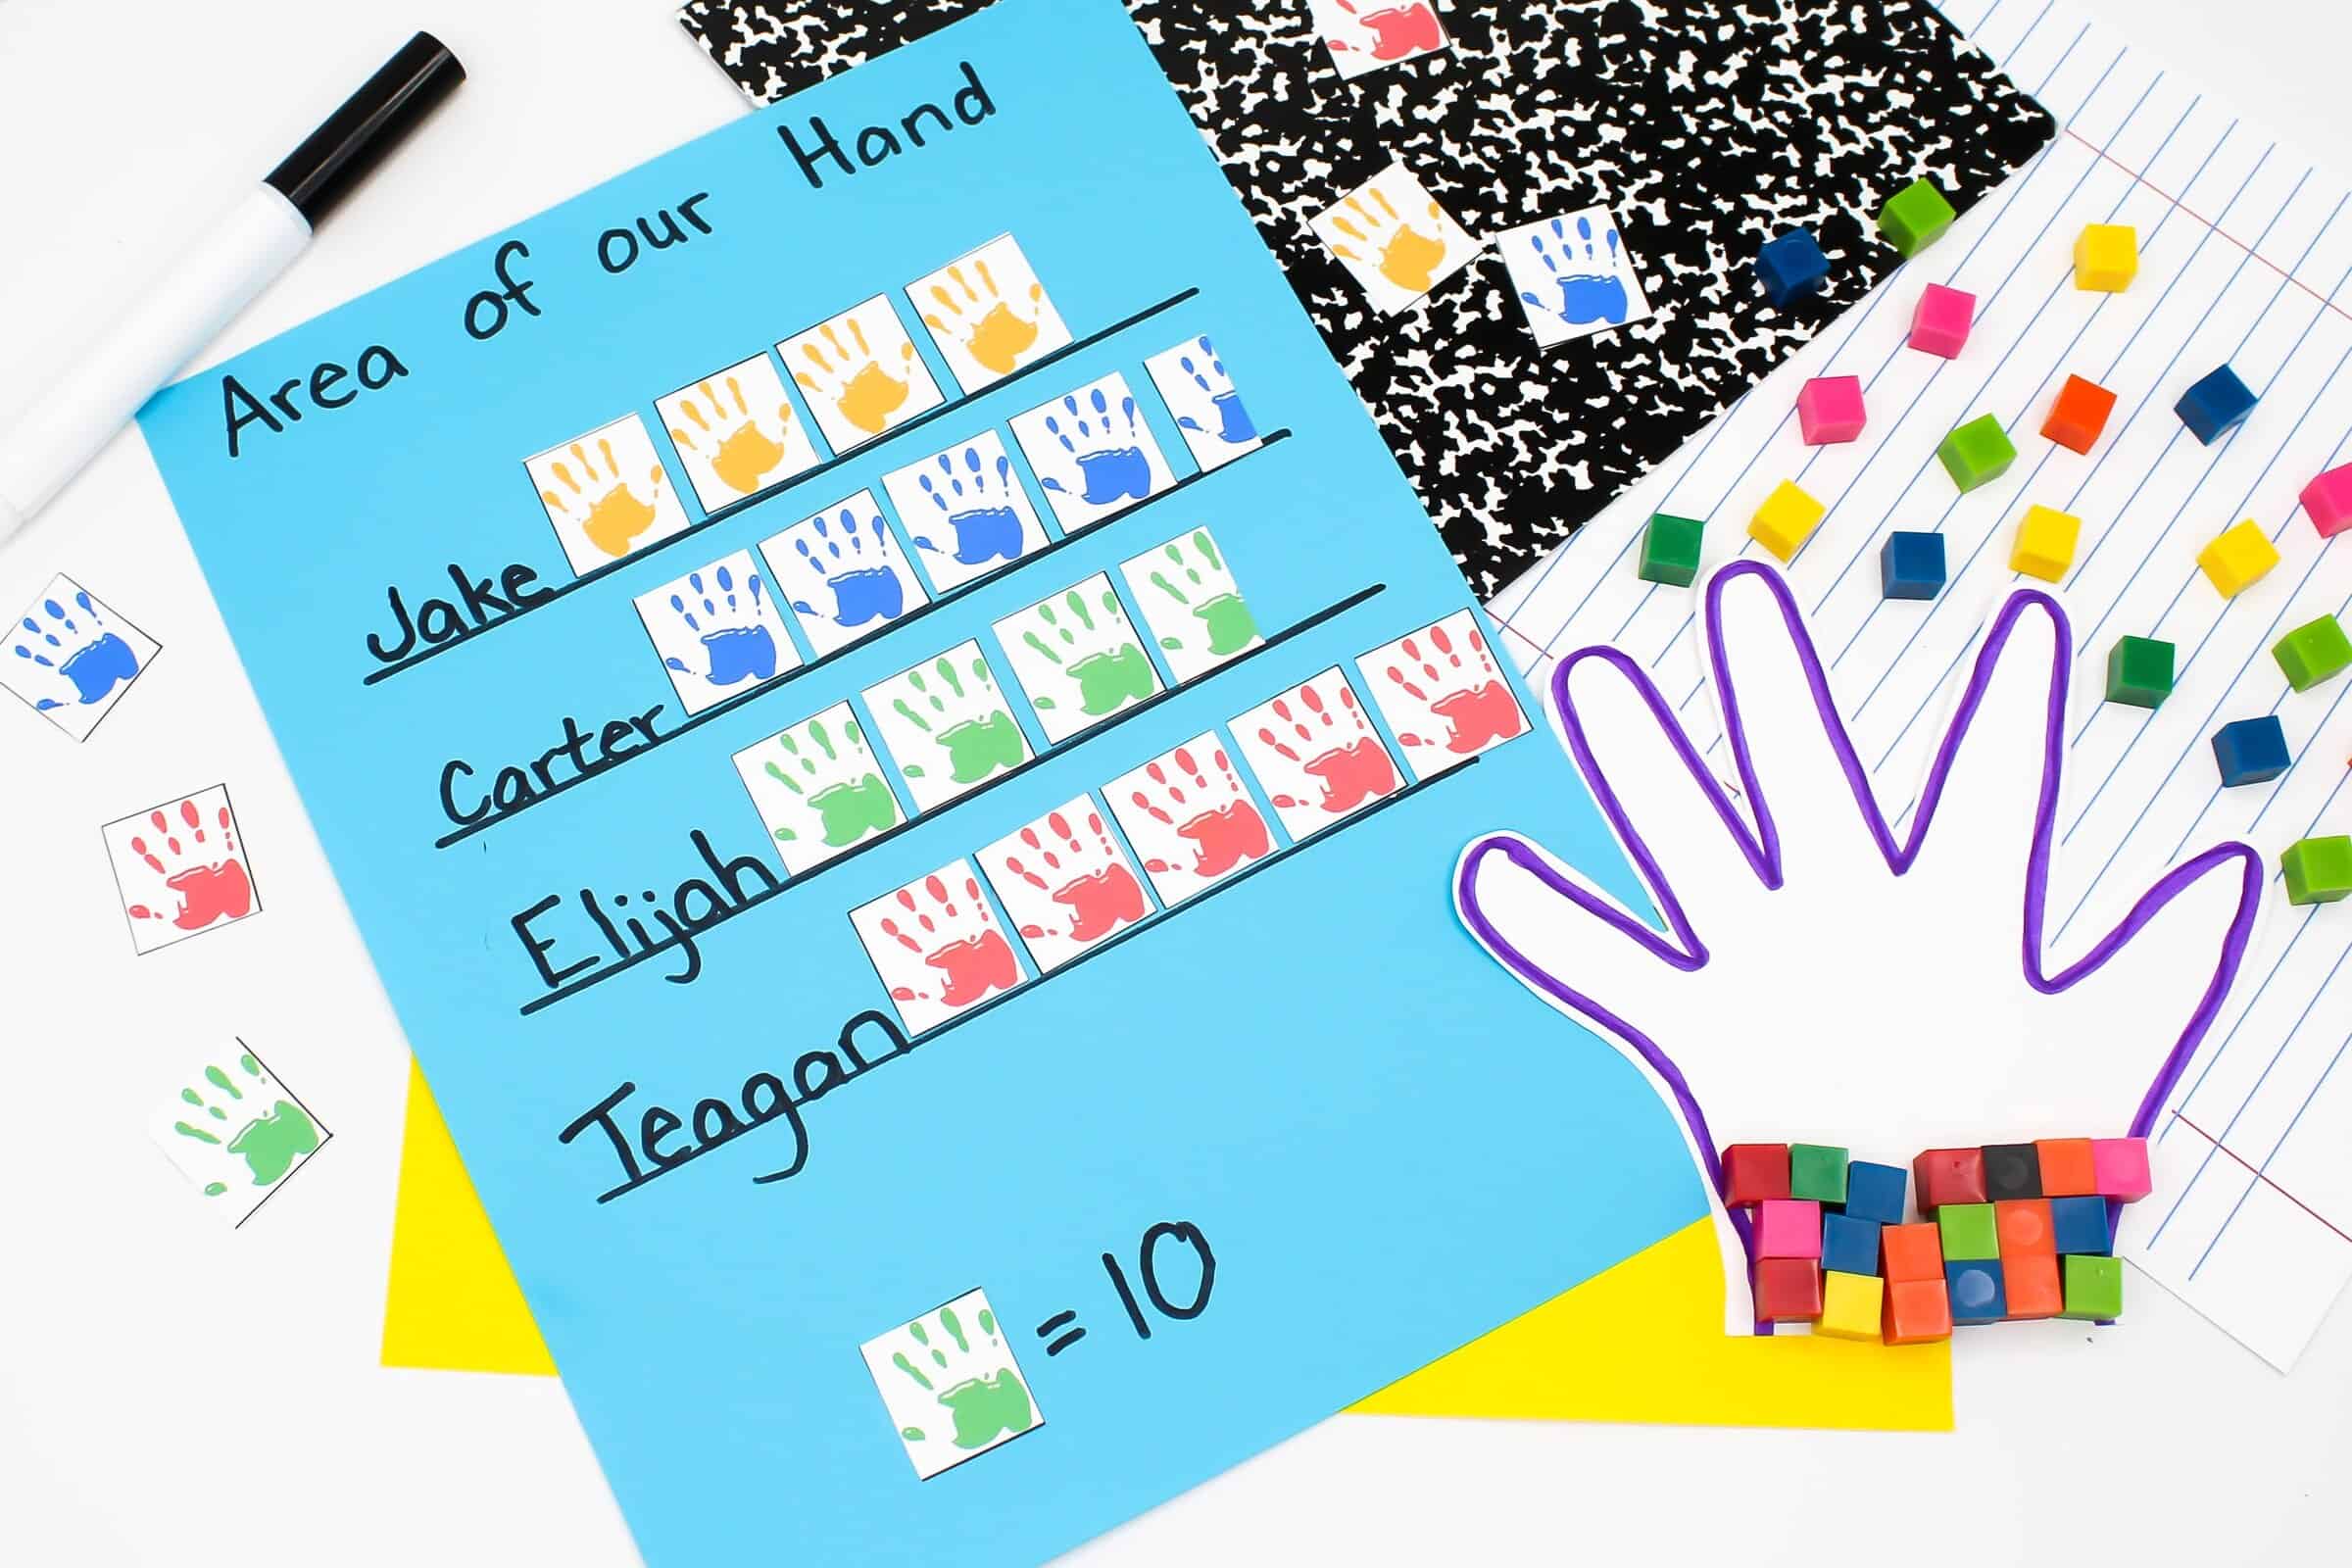
Graphing Worksheets – Area
Have students use cm cubes find the area of their hand. Another option for finding the area is for students to trace their hand on cm grid paper. Have students to work in groups of 4 to create a picture graph (using hands as their picture) that represents the area of each student in the group’s hand.
Groups will need to determine how many square centimeters each hand on their graph represents. Students can use the color coded hand pictures to help them create their picture graph. After students complete their graph, have them write questions that can be answered using information from their graph.
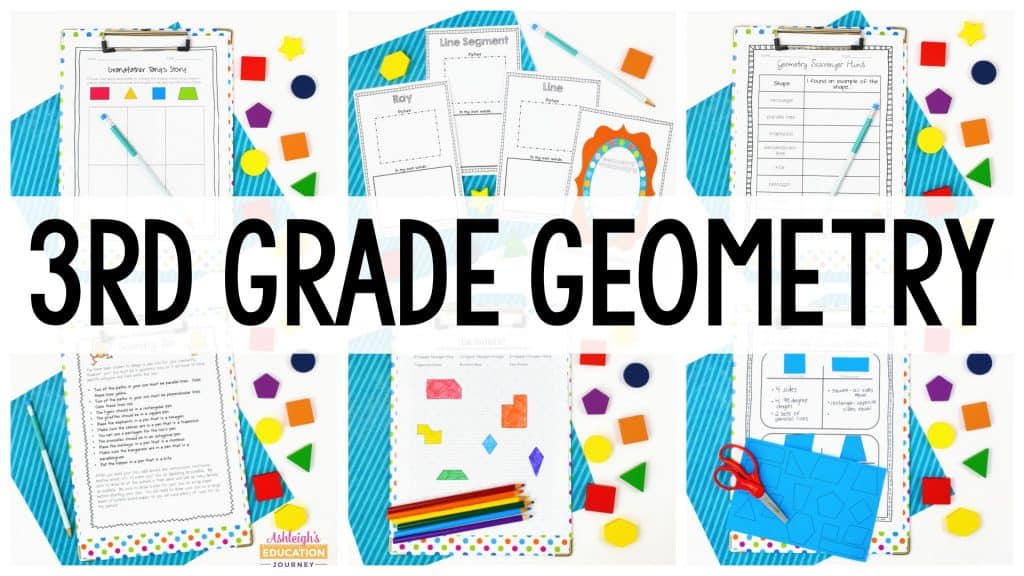
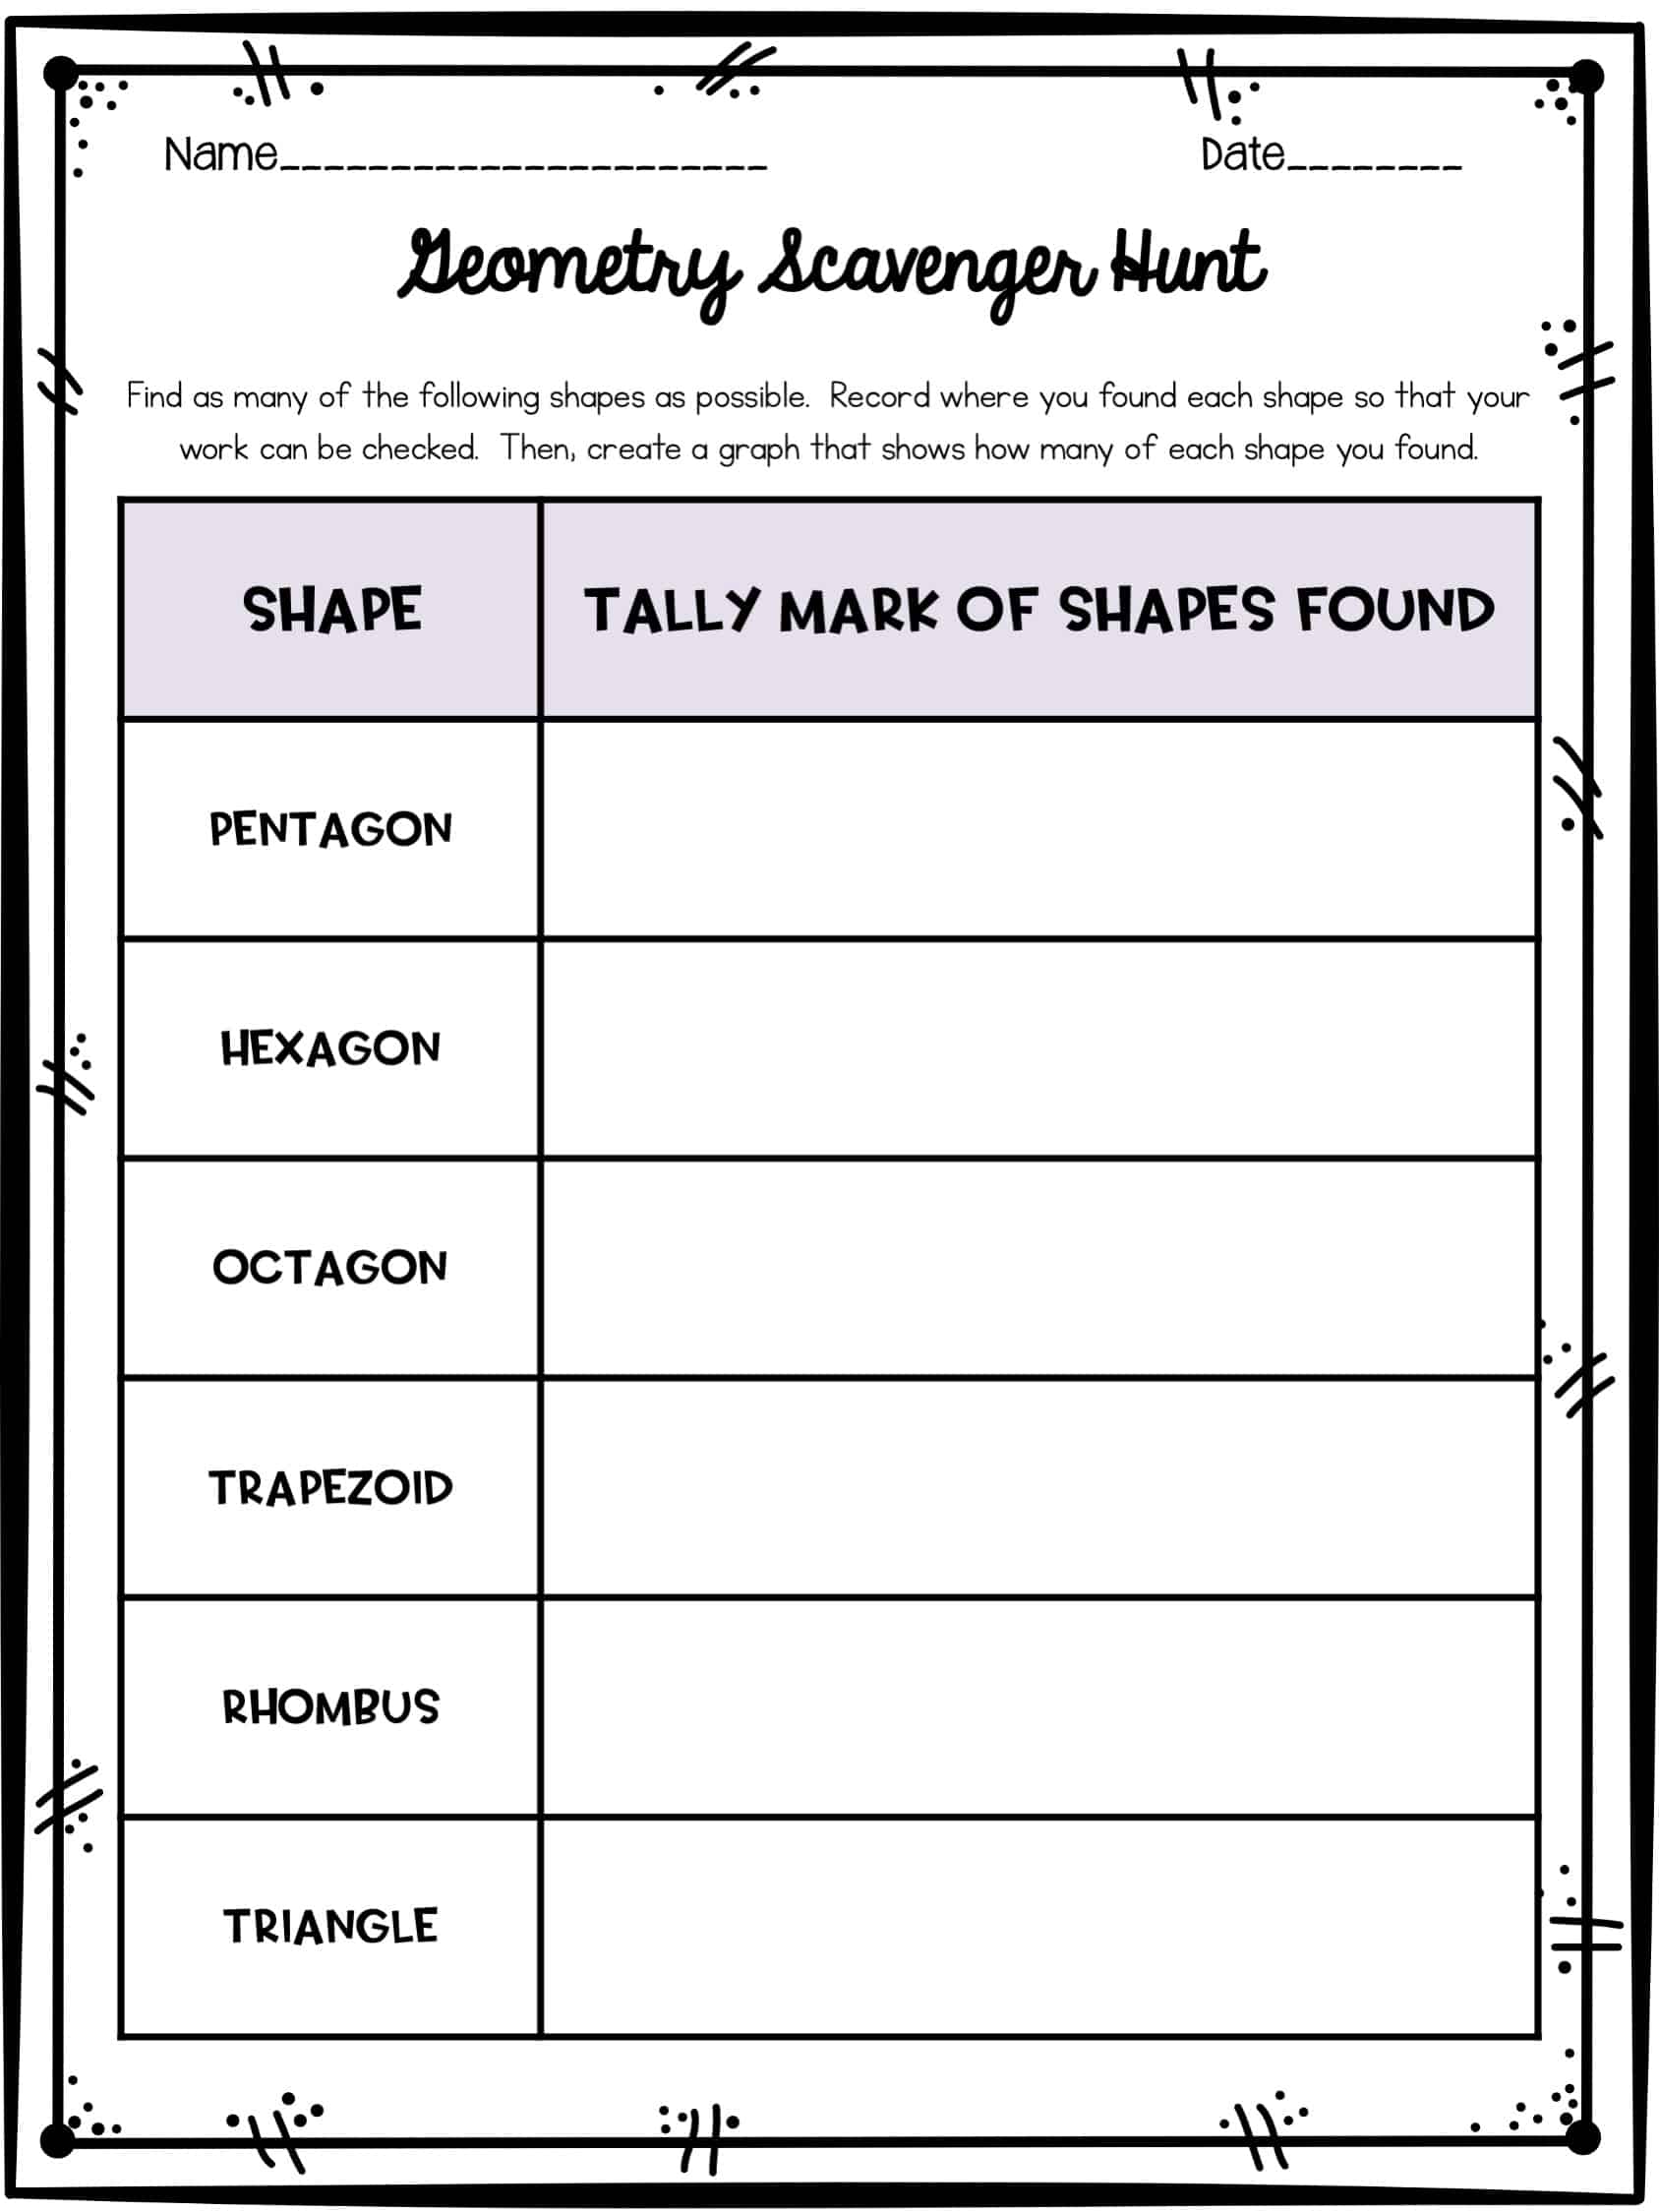
Geometry
Have students go on a geometry scavenger hunt! Students tally how many of each shapes they find and create a bar graph to show how many they found. Naturally, have students be ready to tell you what their examples are. Otherwise, the quantity of examples tends to be a bit skewed!
Each of the lessons in this post can be found here! These lessons has inspired me to think of even more ways to incorporate data analysis and graphing into our math units.